As already stated in the introduction to our project, we decided to create a Cloud Foundry-Application in IBM Bluemix. We used the boilerplate called “Internet of Things Platform Starter”. Using this boilerplate Node Red is deployed initially.
Node Red is a software tool for graphical dataflow programming. It was developed by IBM and is open source since 2016. Providing a browser-based flow editor it enables to wire together hardware devices, APIs and online services.
Since it was already deployed we decided to give it a try. Getting started by setting login credentials for your flow editor and following some beginner tutorials was quite easy. Most of those easy tutorials use the inject node to insert some sample data or the twitter node to receive tweets for a specified hashtag and use them as input data.
Receive, display and save live data
Unfortunately we wanted to work with data from our Raspberry Pis instead of any tweets, which was not that intuitive anymore. After trying out some nodes using websockets seemed to be the easiest way to get started quick. WebSocket is a computer communications protocol, providing full-duplex communication channels over a single TCP connection. Since we only need to send data from our Raspberry Pi to the cloud application this protocol does not perfectly fit our needs and causes some overhead, but to get started it was ok. Configuring the websocket node like this:
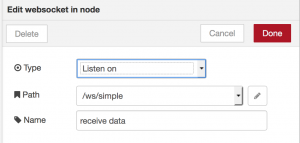
and sending the data from the Raspberry Pi to https://use-your-data.mybluemix.net/ws/simple using the websocket client library, worked out pretty good.
The data comes in from the websocket as a String, which can easily be parsed to JSON by just passing it through the JSON node, as long as the String contains a valid JSON object. But debugging malformed JSON using error messages from the node red flow editor is not recommendable.
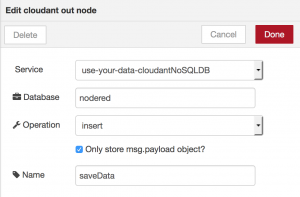
As a next step we used the cloudant-out node to save our JSON data. Cloudant is an IBM software product based on the No-SQL CouchDB. It is integrated into the Internet of Things Platform Starter Boilerplate we used as default database that is already connected to the application and already contains a database called “nodered”. By configuring the cloudant-out node to use these defaults, saving our JSON data worked straightaway.
So far our JSON data looked for example like this:
{
    "timestamp":"2017-08-18 10:22:11.882596",
    "device":"raspiMQ135",
    "values": {
        "CO2_NH4": 3.85567e-05,
        "CO": 1.80491e-12,
        "Alcohol":0.00175228
    }
}
(It contains some strange values because the gas sensor was not yet calibrated correctly as described in Part 2 when the Node-RED application was built.)
Since first of all we were only interested in the values from our sensor we needed to split our JSON object. The data passed through a node red flow is called a message (msg). By convention each message will have a msg.payload property containing the actual data. Other nodes may attach their own properties to the message, and they should be described in their documentation. A property that is quite common in some nodes is the msg.topic.
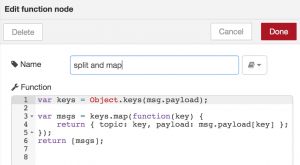
We decided to use a function node that creates a new message for each key of our JSON object, writes the key to msg.topic (because we need this property later in our dashboard nodes) and adds the corresponding value to msg.payload. The function-node is like an all-round node because it allows any JavaScript code to be run against the messages that are passed in and then return zero or more messages to continue the flow. But therefore this node requires actual coding instead of just configuring a node.
Now we have single messages containing timestamp, devicename or values. Since we are only interested in displaying our values we use a switch-node to differentiate between them.
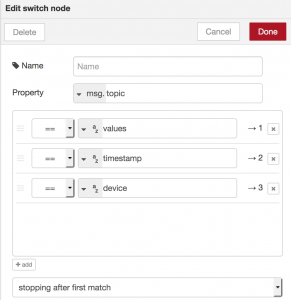
Looking at node’s configuration makes it quite self-explaining: define a property to look at and define filtering rules that tell which way out of the node a matching message should take. Instead of equality it is also possible to filter based on regex and other criteria.
Continuing only with our values we use again a function to split them and set the keys as msg.topic. The only difference to the function node before is that the node now has three outputs, one for each value, instead of sending all the messages through the same output.
Finally we send our values to dashboard-nodes. These additionally installed nodes create a website under /ui. To display our data especially chart- and gauge-nodes are useful. We mainly kept the default settings of these nodes and instantly got some suitable charts.
But unfortunately reloading them on every new message they received is not implemented very browser-friendly and made stuck everything.
The probably best solution for this problem would have been to aggregate some messages in the flow before inserting them into dashboard-nodes. Luckily there is an aggregator-node ready to install to our node palette. Unluckily this node does not keep the value set to msg.topic. Instead it overwrites it with an empty string or a new value you can specify, but you cannot reference the old value to set as the new one again (at least not in any common way that we tried out). So we decided not to use the aggregation node and ended up with this flow to receive, display and save our live data:
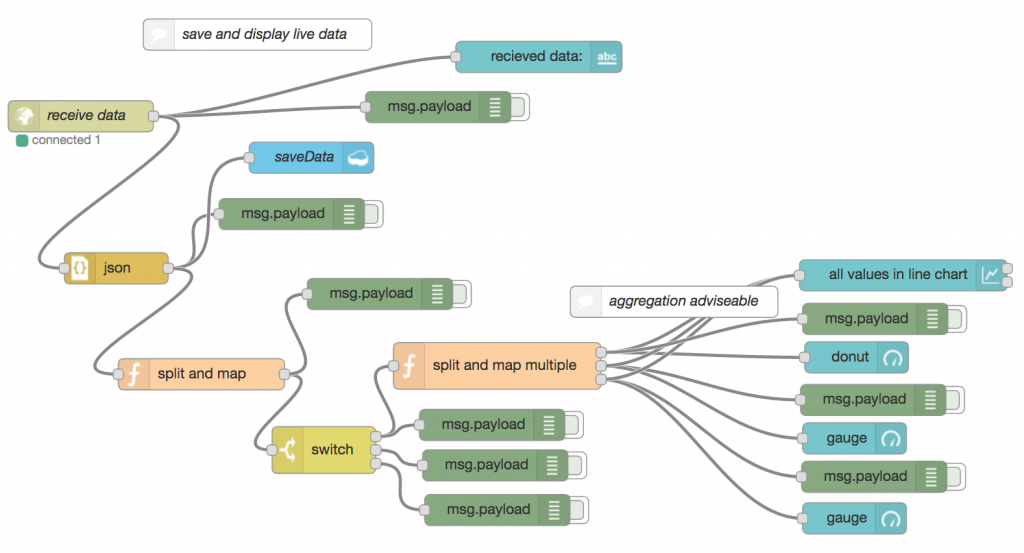
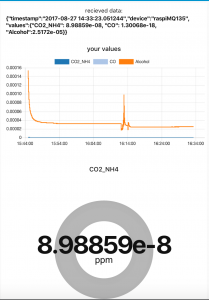
The upper part of the dashboard page this flow creates looks like this (remember that the sensor is still not calibrated correctly here).
Query saved data from cloudant db
After saving our data to CloudantDB was that easy of course we also wanted to query that data again to display legacy data. Setting up the cloudant-in-node to query all data saved to our database so far was not very complicated either. But of course we needed some more specific queries which turned out to be not that easy anymore.
First of all an index is required for any specific query. To create one you need to access the dashboard of your cloudant service, which can be found in the Bluemix dashboard. To retrieve legacy data we needed an index on our timestamp field and after reading some slightly unorganized cloudant docs we ended up with a very basic index. Testing it inside the cloudant dashboard returned the expected result.
Index
{
    "index": {
        "fields": ["timestamp"]
    },
    "type": "json"
}
Query
{
    "selector": {
        "timestamp": "2017-06-22 21:16:43.880295"
    },
    "fields": [
        "timestamp","device","values"
    ]
}
Result
{
    "timestamp": "2017-06-22 21:16:43.880295",
    "device": "raspiMQ135",
    "values": {
        "CO2_NH4": 0.00000511376,
        "CO": 1.61913e-14,
        "Alcohol": 0.000426041
    }
}
But using the cloudant-in-node in our node-red flow did not work at all using our index and the same query. Even after googling around and trying out a lot of different configurations of the node and different format variants of the input including the query this node did not return the desired result. In most cases it returned “couch returned 400” or other error codes instead, which makes debugging quite cumbersome.
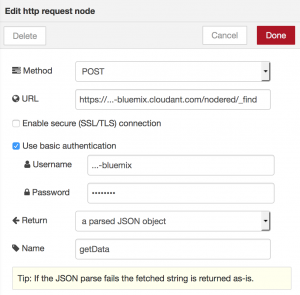
Finally we gave up on using the cloudant-in-node and to use a different way to query our database from within our node-red flow. Since it is also possible to query a cloudant database by posting the query to the URL https://[cloudantusername]-bluemix.cloudant.com/[nameofdatabase]/_find we managed to use the http-request-node to get the desired results from our database. The endpoint is protected through basic authentication by default and adding credentials therefore is quite easy – as long as you know them. But your cloudant credentials are not the same as your Bluemix credentials although navigating from your Bluemix dashboard to your cloudant dashboard does not require an additional login. Searching for cloudant credentials finding the username is the easier one. You can find it for example included to the link in browser when you are on your cloudant dashboard. To get a password for your account you need to navigate through your Bluemix dashboard to the cloudant service and there create a new entry under “Service credentials” where you can set a password.
So we ended up with the following configuration for our http node.
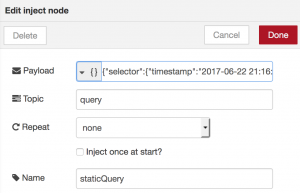
And at first inserted only a static query using an inject node that sets our query as msg.payload and msg.topic to “query”.
Afterwards we used the same function as in our displaying live data part to split the data object of our result and map its values to its labels and finally we used simple text-dashboard nodes to display them.
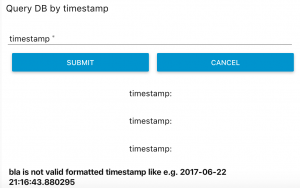
Later we also added a form-node to our dashboard to insert a timestamp to query for. We also added some very basic input validation using a switch node which checks the input for the correct format using a regex and then either an error message or a DB query is created using function nodes.
So our final flow to query our database looked like this:
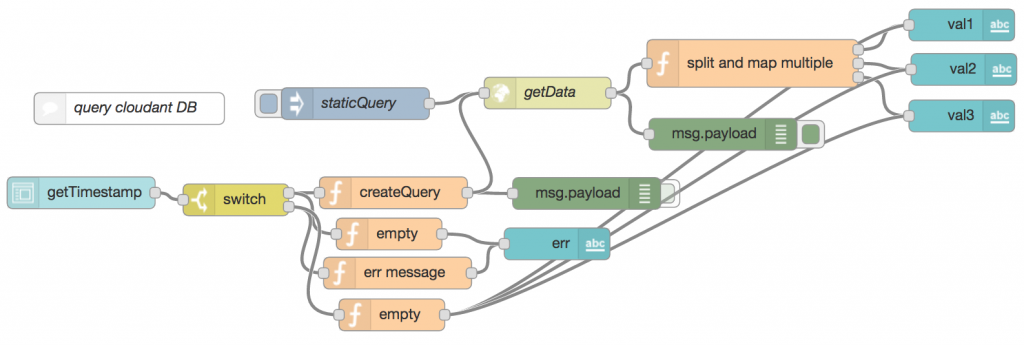
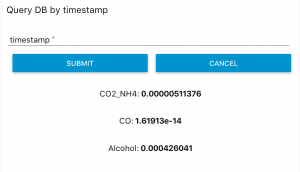
Which resulted like this on our dashboard page:
Conclusion: Pros and Cons of Node Red
Of course this query feature is quite poor so far because you need to know the exact timestamp of an existing entry in the database otherwise the query won’t return anything. Also the dashboards that display the live data are still pretty bad. But at this time we reached the point in our project when we decided to turn away from node-red and implement our project in real code instead.
Most of the problems we experienced using node-red that lead us to this decision were already mentioned above. The major problems in short again:
- Some nodes do not really fit to each other like the aggregation-node that is not able to pass on a value set to msg.topic with dashboard-nodes that require these values
- Documentation of some of the nodes is pretty poor
- Debugging can become quite difficult since all you can do is use debug-nodes or console logs inside of function-nodes but it is not possible to see what is going wrong inside of a node
- Some things to do still require you to write code in function-nodes or maybe even to write your own nodes
All in all node-red seemed to us still poorly conceived and not as intuitive as it might look like at first sight.
Anyway graphical dataflow programming of course also has its benefits. The clear view of a program you can achieve when doing it right (by keeping flows as simple as possible) makes initial orientation and maintenance easy. It also becomes possible to talk about a program with domain experts that do not have any software development knowledge.
But at the moment node-red is not sophisticated enough therefore. It might fit one’s needs as a prototyping tool yet.
Leave a Reply
You must be logged in to post a comment.