Introduction to the project
As part of the lecture “Software Development for Cloud Computing” in summer term 2017 we primarily wanted to work on a project that has something to do with the Internet of Things. In more detail we decided to measure air quality using a Raspberry Pi with the MQ135 Gas sensor and send this data to our self-built cloud application to analyze it.
We started out by getting IBM Bluemix student accounts. Playing around with different Bluemix Services we found the IBM Watson IoT Platform which can display data you can send to it from other devices out of the box. Despite displaying the data in charts it is also possible to create rules and send alerts based on them and to authorize other Bluemixusers to manage your devices as well.
But we didn’t like that it is all integrated into Bluemix and therefore requires you to set up an user account which turned out to be way more complicated as we expected and you need to navigate through Bluemix’ sometimes quite confusing user interface.
For that reason and way more important because we wanted to learn how these things work in detail and get some experience with them, we decided to implement our own application with partly related functionality.
In our blogposts we want to share our gained insights and therefore these posts are going to cover the following topics:
- The setup of Raspberry Pi and MQ135 gas sensor including the physical connection between both as well as calibration of the sensor and reading and sending the data using a python script
- An overview of the Dataflow programming tool Node-Red which we tried out for building our cloud application
- An introduction to the MQTT Protocol which we used to transfer our sensor data to our cloud app including setting up our own MQTT Broker
- How we built our actual web application upon the IBM Bluemix Cloud-Platform as a Service using Node.js, MongoDB, Bootstrap 4, Webpack, Gitlab CI and a couple of Frameworks like Express, Passport, Chart.js and others
Setting up Raspberry Pi and MQ-135 Gas Sensor
Connection between Raspberry Pi and MQ-135 Gas Sensor
Accessories:
- The MQ-135 (as well as many other MQ-X gas sensors) needs 5V to work correctly. Since it is not recommended to put 5V on Raspberry Pi’s input GPIO, we need to put a 5V to 3.3V Logic Level Converter between them.
- Because our sensor’s output is an analog signal, we also need an Analog-Digital Converter to convert the signal for our Raspberry Pi.
- Furthermore a Breadboard and of course jumper wires are required for the connection.
For setting up we mainly followed this tutorial except that we used a different Logic Level Converter. Being our first project using a Raspberry Pi’s GPIO parts of this tutorial seemed to be a bit complicated. That is why we are going to try to explain things in different maybe easier way using numbers in the picture here again.
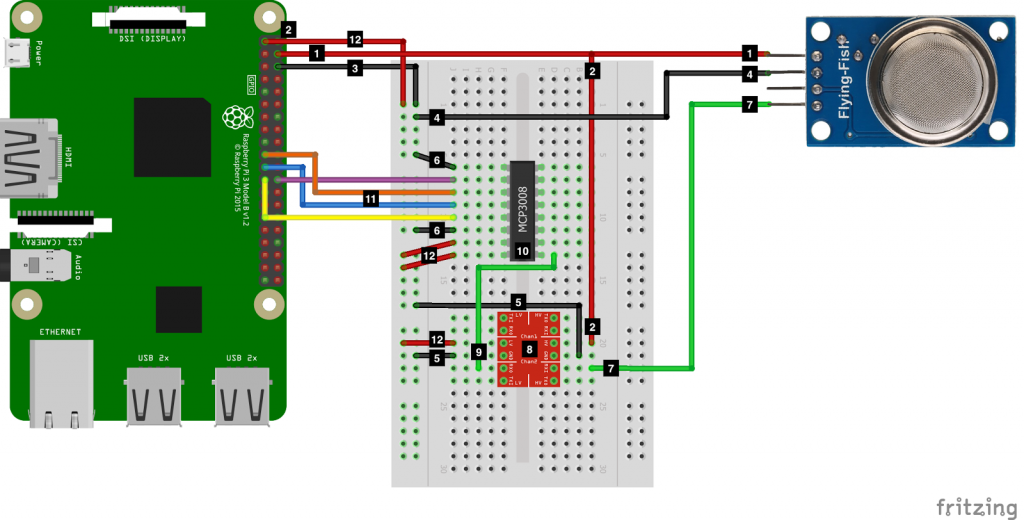
- To supply power to our sensor we used the 5V pin from our Raspberry Pi even though this not recommended when more other external devices (keyboard etc.) are plugged in.
- Instead of what looks like a split wire here we just used another wire from the other 5V pin of our Raspberry Pi to connect it to the Logic Level Converter.
- Connect the Ground pin to the breadboard.
- And from there connect it to the sensor.
- As well as to the logic level converter once on each side (8)
- And twice to the analog digital converter (10)
- The green wire is the analog response signal from the sensor which first needs to be converted from 5V to 3.3V by the logic level converter.
- As logic level converter we used a 8 channel one called SKU:AC-LLC8-V2 that was included in a Raspberry Pi starter package we bought but unfortunately not labeled the same way as the one in the tutorial nor documented in any way. Luckily every logic level converter works mainly the same way. So we figured out that we can put our response signal wire (7) onto almost any pin (we chose A0) as long as we plug a 5V wire (2) onto the same side (pin VCCA). Onto the counterpart of VCCA (VCCB) we need to plug the lower voltage we want to convert our signal to. So this is 3.3V coming from the Raspberry Pi (12). Then we need to plug ground wires to the “GND” labeled pins of each side (5).
- Finally we can receive our response signal converted to 3.3V from A0’s counterpart B0 and wire it up to our.
- Analog digital converter (MCP3008). There are more detailed tutorials on how to use an analog digital converter to convert and read analog signals using the I2C bus of a Raspberry Pi. (here you can find a German one for example). But for here it is enough to just wire it up to the data from our sensor (9), ground (6) and 3.3V (12) from our Raspberry Pi.
- Then it is possible to read the signal using the Raspberry Pi by connecting it with the analog digital converter as shown.
- Raspberry Pi’s 3.3V are connected to the breadboard and used by the analog digital converter (10) and the logic level converter (8) mainly as reference value.
Our real-life result looked like this and worked as expected.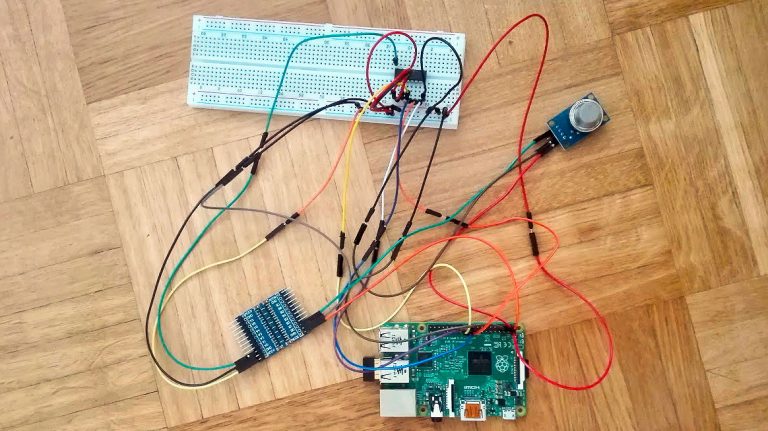
Calibration, reading and sending the data
For calibration of a MQ-X gas sensor first of all the according datasheet to the sensor is needed. By googling “mq135 datasheet” a couple of them can be found for example this one. But unfortunately none of these provided the chart that is needed for calibration with a completely readable legend. This problem has been solved by prolonged searching for a datasheet that doesn’t contain a broken font. We found it here, it was listed on page 5 of the results on the international Google search. Now we were able to translated the chinese characters easily with with Google Translate and were able to fully detect all the gases the sensor responds to.
We also tried configuration and calibration of our sensor as explained in the already mentioned tutorial. But this didn’t really work out for our sensor because we ended up with very unrealistic values.
To get realistic values we’ve looked at another guide which can be found here.
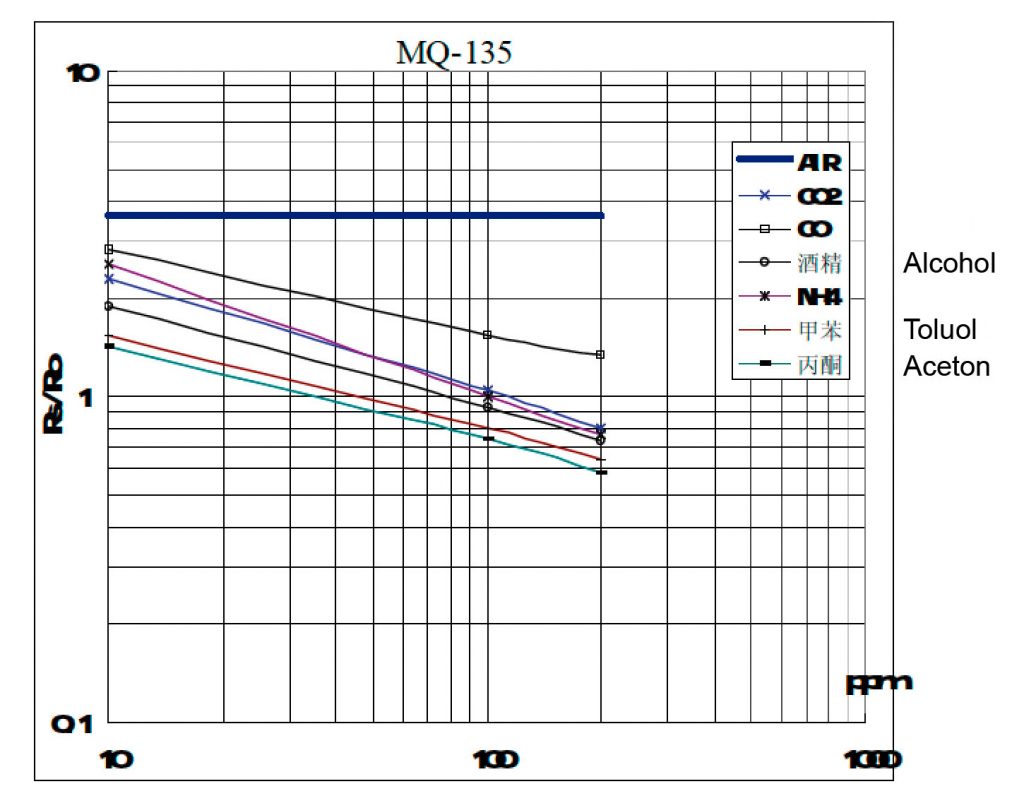
In the logarithmic graph for sensitivity characteristics it can be seen that the gas curves are power functions.
y = a*x^b
In order to determine the sensitivity for the desired gas (CO2) we have read the coordinates of two points, once at x = 10 and once at x = 200, on the CO2 curve. Through power regression we can obtain a scaling factor (a) and an exponent (b) for the gas which is necessary to compute the value of the output.
ppm = a*(Rs/Ro)^b
To calibrate the sensor also a value of the gas in clean air is required as a reference. We have taken it from http://co2now.org/. With all these values, the measured CO2 content can now be calculated in ppm. This guide provides a script written in C that takes this task. We have translated this script for the Raspberry Pi into Python.
In order to send the determined data to Bluemix, first the Raspberry Pi must be registered as a device in the IoT Platform. At the beginning we sent the data to the cloud using the Websocket protocol from the Python application.
Leave a Reply
You must be logged in to post a comment.