New data is created every second. Just on Google the humans preform 40,000 search queries every second. By 2020 Forbes estimate 1.7 megabytes of new information will be created every second for every human on our planet.
However, it is about collecting and exchanging data, which then can be used in many different ways. Equipment fault monitoring, predictive maintenance, or real-time diagnostics are only a few of the possible scenarios. Dealing with all this information, creates certain challenges for stream processing of huge amounts of data is among them.
Improvement of technology and development of big scaling systems like IBM Bluemix it is now not only possible process business or IoT data, it is also interesting to analyze complex and large data like sport studies. That’s the main idea of my application – collect data from a 24-hour swimming event to use real time processed metrics to control event and athletes flow.
In this article explains how to integrate and use the IBM tools for stream processing. We explore IBM Message Hub (for collecting streams), the IBM Streaming Analytics service (for processing events) and IBM Node.JS Service (for visualization data).
Scenario
In the swim sport, there is a competition called “24-hour swimming”. The goal is to swim the larges distance within 24 hours. Don´t worry! It is allowed to leave the pool whenever you like and take as many breaks as you want. In an earlier project, we developed a server/app combination to count the laps of each swimmer electronically. You don’t need to have people sitting around the pool any longer and counting by hand with pencil and paper. But there is still a problem. Each swimmer can choose the lane he wants to swim on by his own. Most people consider to be faster than they really are. So why don’t process the data, each tap of the counting app produces to calculate averages of swimming time for each lane.
Below is the scheme of a stream processing flow that we will implement in this post.
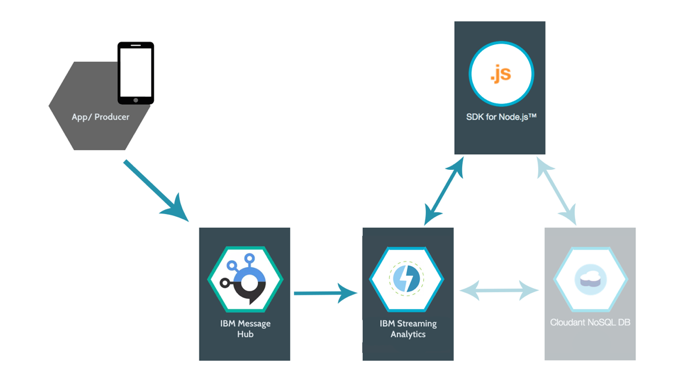
Event Producer or in production the app sends messages, which then go to Message Hub. IBM Streaming Analytics Service receive them up from Message Hub, process and send calculated metrics to the Node.JS App which visualize the data. In further development Streaming Analytics store the data into an Cloudant storage on which the node app can make some lookups.
IBM Message Hub
The IBM Message Hub is a fully managed, cloud-based messaging service. It is built on the open source Big Data tool Apache Kafka and is available through IBM Bluemix® Platform. Each message which is send to the Kafka Cluster has got a topic. This topic allows us to send various messages within our Kafka environment and make some addressing. This is especially useful to set up a micro service environment. In our case we just need one topic because all our data, that the apps are sending, should be processed.
The reason why we need to use a service like the Message Hub is caused by the policy rules for IBM Bluemix services. The Streaming Analytics service provides a function to receive directly messages but these messages have to be sent within the IBM Bluemix system. That’s the reason why we take this detour through Message Hub.
Because Message Hub is based on Apache Kafka all client libraries for communication are full compatible, e.g. for Android Apps there is an Java Library or some for Node.js .
To set up and configure IBM Message Hub check out this sample.
IBM Streaming Analytics
Streaming Analytics is a full managed service, which allows us to build streaming applications with ease. The developer doesn’t have to worry about managing and configuring the infrastructure like an apache Spark Service, which is also offered by the IBM Bluemix infrastructure. But because that service comes out of the box you have first to configure it. That is a big advantage of Streaming Analytics. Developer can focus on building business logic and analytics. The service supports real-time analytics with extremely low latency and high performance. Either your application supports a single device and data source or connects and monitors hundreds of thousands of devices, Streaming Analytics performs seamlessly and reliably.
The usage of the Streaming Analytics Service is really simple, either interactively through the Streaming Analytics Console[1] or programmatically through the Streaming Analytics REST API.
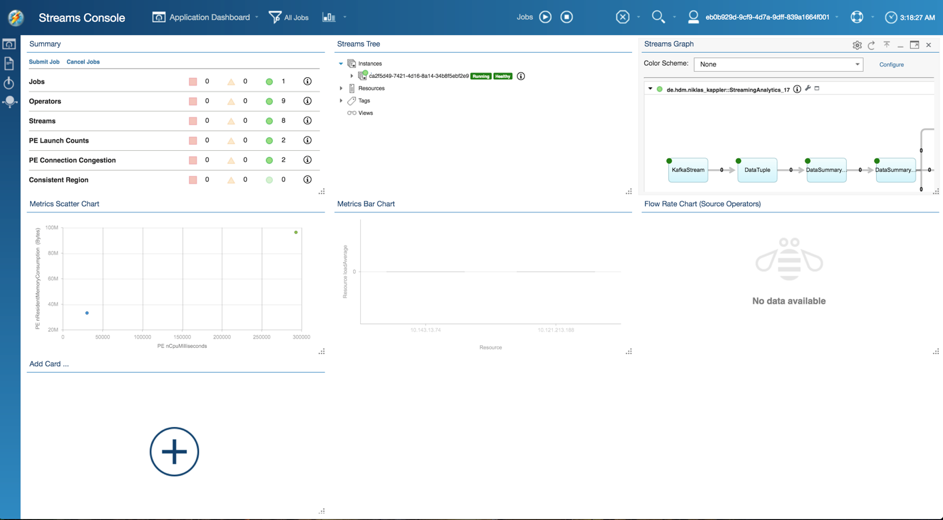
Through this service you can add a Streaming Analytics application e.g. an instance of that application running in the IBM Bluemix cloud. Scale the instances, check errors or get a visualization of the data flow graph.
IBM Streaming Analytics Application
When submitting a job to the IBM Streaming Analytic Service, you are prompted to identify a Streams Application Bundle (.sab) to upload and submit. The Streaming Analytics service in Bluemix requires to develop your Streams application in another Streams environment, outside of Bluemix.
IBM Streaming Analytics is beside the usage within the Bluemix a stand-alone product for usage on your own hardware to set up a Streams environment. If you don’t already have a Streams environment where you can develop and test applications, you can develop locally using the Quick Start Edition. The virtual machine provides a preconfigured Streams environment with development tools.
Developing these types of applications is easy and can be done in multiple ways. Streaming Analytics supports a Java Application API, which means any Java developer can crank up an application with extreme ease. Same for Python developers.
But the easiest way is to develop applications with the IBM® Streams Processing Language (SPL). It is a java near syntactic language for describing data streams with a lot of build in operators.
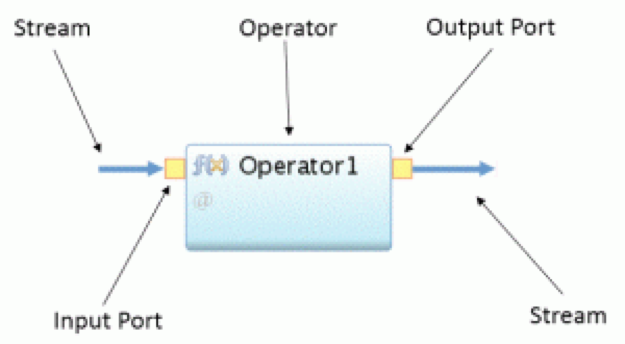
To write a Streams application, you first need to understand the basic building blocks. A single block is an operator. A block consists of input ports and output ports. A input port consumes a stream of continuous records. An operator can have one or more input ports. Through the output port an operator processes the records and create a new Stream. An operator can have one or more output ports.
A Streaming Application consists of a flow graph of operators. Each block in that graph takes one small task like prepare, filter or aggregate on the records. A record is called a tuple. Each stream has a defined data structure e.g. a defined structure of a tuple and a stream consists only of one type of tuples.
The Info Sphere Streams Studio supports an interactive or programmatically way building your SPL applications. Below we see our application for processing the swimming data.
 First we are reading our data from a Kafka Consumer e.g. read from Message Hub. After that I prepared the tuples to the right format. So one touple consist out of an ID, the name of the swimmer, the lane he is swimming on, an actual timestamp and the time remaining from last count. In Code it looks like this:
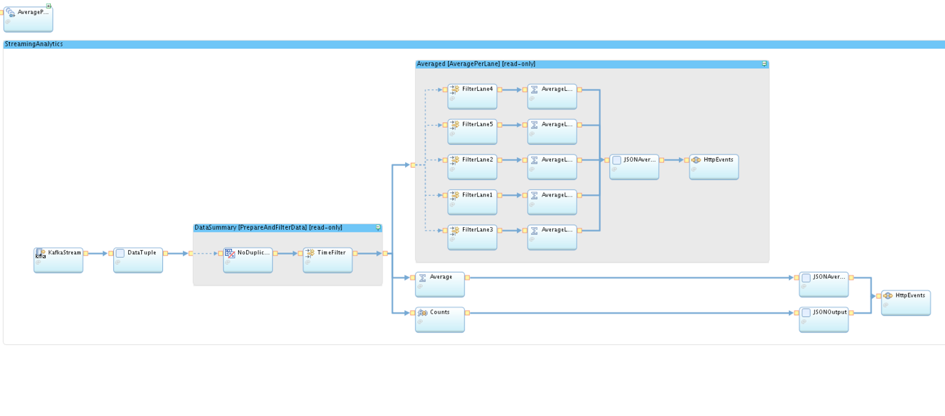
In top we see the schema of our touples. The Composite is a wrapper for one graph which is declared here with graph. We see beginning with “stream” our first block reading from Kafka/Message Hub. The second block is the converting block convert the message from Kafka to our schema.
After these preparation I did some filtering to remove wrong tuples like if the time between two tuple is under 21 seconds, which is the world record for 50m swimming. The second tuple will be removed from stream because something can´t be right. Same procedure for duplicates within the stream.
After that our stream splits up into one block counting the total amount of meters, one for the total time average per lane and beyond another filtering the calculating of the averages per each lane. At the end the calculated metrics be converted back to a JSON string and send via HTTP to our Node.js Application.
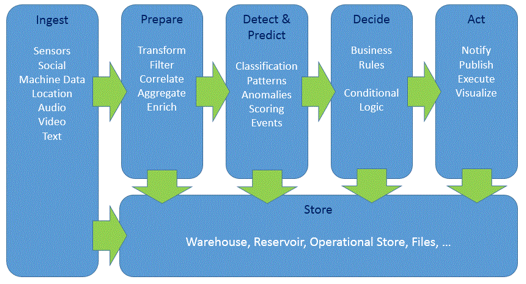
While writing Streaming Application it is highly recommended to regard design pattern for processing the data to keep your application performant as possible. The following diagram shows a good approach for developing such stream applications.
Node.JS SDK for Bluemix
The Node.js app is used to visualize the data we calculated, based on a simple Node.js environment for Bluemix. The App also controls our Streaming Analytics Application through the Rest Interface of Streaming Analytics for Bluemix. So we did not have to upload the Streaming Application manually. The Streaming Analytics Service is connected to the Node.js App so we can share credentials and also send the data from the Analytics Application via HTTP. For easy creating charts I used Char.js.
Final Thought
Streaming Analytics is an fascinating part of the possibility systems like Microsoft Azure Cloud or IBM Bluemix offers. Not only the crazy idea of ruling that mass of data makes that fascination. It is more the ability to proceed them in real time, making description.
Creating this little project showed me that the technology is available for everyone but that are only a few out there using it. There are so many use cases like real time suggestions while online shopping, better insights into exchange market or faster processing of medical test like an DNA analysis. But I realized also that it is not that easy to find metrics which are of interest and in my opinion that distinguish a Big Data analyst from a good one. He knows which metrics are interesting for the client, which could be interesting or which new key metrics he can calculate.
All together it was interesting getting in touch with that technology and I hope I could share some information with you getting in touch with Streaming Analytics.
Here are some links which helped me getting started about SPL (https://www.ibm.com/support/knowledgecenter/SSCRJU_4.2.0/com.ibm.streams.dev.doc/doc/dev-container.html) or creating applications (https://developer.ibm.com/streamsdev/docs/bluemix-streaming-analytics-starter-application/).
Leave a Reply
You must be logged in to post a comment.