1. Abstract
Are you searching for country-specific, up-to-date numbers and rates for the global pandemic caused by COVID-19? Well, then I got some bad news for you. You won’t find any in this blog post… not directly anyway. If you are looking for in-depth information about public APIs, location-based data visualization or cloud-based Node.js web applications on the other hand, I might just be the right guy to help you out.
After reading this post you will not only have detailed information about the previously mentioned topics, but you will also learn about the challenges and problems I had to face working on this project and what to look out for, when starting a web application from scratch all by yourself.
2. Introduction
This project is the result of the examination that is part of the lecture “Software Development for Cloud Computing”. The focus of this lecture is to learn about modern cloud computing technologies and cloud services like AWS, Microsoft Azure and IBM Cloud, how to create and develop software using these technologies as well as creating a cloud-based project from scratch.
At first, I wasn’t quite sure what I was going to work on, but I really wanted to work on a web application that uses location-based data in the form of a map to visualize something else. This “something” was yet to be determined when I started brainstorming for my project, so I started to do some research. I then bumped into this collection of free and public APIs which was perfect for my undertaking and I was almost set on creating a weather app, when I found a free API that would provide me with global data all around the Coronavirus.
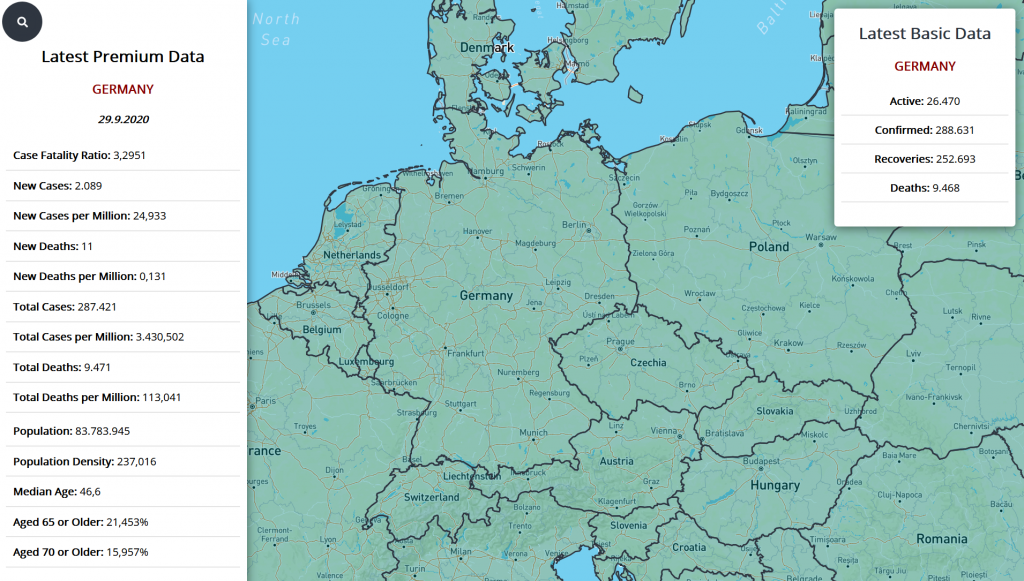
Now that I knew what I was going to visualize I came up with a personal scope for this project. I decided to create a web application that would deliver COVID-19data for a specific country by either hovering or clicking on this country, as well as a search function, so that the user could jump to a country of choice by entering the name of a city or a country. Since I had only very limited knowledge about web applications and cloud computing as such (I have worked bits and pieces with Microsoft Azure during my 6-months internship at Daimler before, but never really worked with Node.js or a map library) I did some research first, but I was very confident that I could reach this goal.
3. More Research
Now that I determined what I was planning on doing, I had to figure out which tools and cloud technologies I was going to use. Since I already had a little experience with Microsoft Azure it seemed obvious to settle with Azure and the Azure Maps Service for my project. But there were a couple problems with that:
Problem 1: In order to create a private Azure Account, even an education account, one has to provide a credit card, which I do not own.
Problem 2: There is no map material in Azure Maps for the regions China and South Korea. Now that isn’t technically a k.o. criteria, but I would prefer to use a service that supports all regions to avoid limitations.
Problem 3: Again, this isn’t a huge problem, but I would rather learn something new and not go with something I already had prior experience in.
So I decided to go with AWS, Amazon’s Cloud Service instead. Even though in retrospect the documentation for AWS is not as good as for Microsoft Azure (at least in my personal opinion), AWS offers a wide range of services and on top of that you can create a free education account with 100$ worth of credits. Unfortunately AWS does not have a location data service from what I could figure out, so I had to decide on an external service.
For map data services I decided to go with Mapbox. Mapbox GL JS is an open-source JavaScript library that uses WebGL to render interactive maps for websites and mobile apps. The advantage Mapbox has over Azure Maps is that it offers all the services I require for my project for free and also covers every region without restriction. Upon creating a free account, a user gets a subscription-key that grants access to all Mapbox services, including Mapbox Studio and the Mapbox Geocoder API which I will get into more detail later on.
4. But how do I get access to data from the internet?
As I mentioned earlier, I stumbled upon a public Web API called covid19api, which offers all sorts of corona-related, up-to-date data for free. In the abstract I promised in-depth information about public APIs, so I might as well lose a couple words about the functionality of Application Programming Interfaces while we’re at it. An API is a software-to-software interface, not a user-to-software interface.
A good metaphor to understand the concept of APIs would be to think of it as a waiter in a restaurant. The waiter(API) takes an order (HTTP-Request) from a guest(user) and delivers it to the kitchen(backend-system) where the order is acknowledged and prepared. When everything is ready the waiter(API) serves the food(HTTP-Response) to the guest(user). Some companies publish their APIs to the public, so that programmers can use their service to create different products. While some companies provide their APIs for free, others do so against a subscription fee. In the case of the COVID-19-API there is a free tier as well as a 10$, 30$ and 100$ subscription option. By subscribing, the user has access to additional data routes and no request-rate limit, the latter led me to subscribing, because I require several requests per second with my application.
5. Architecture
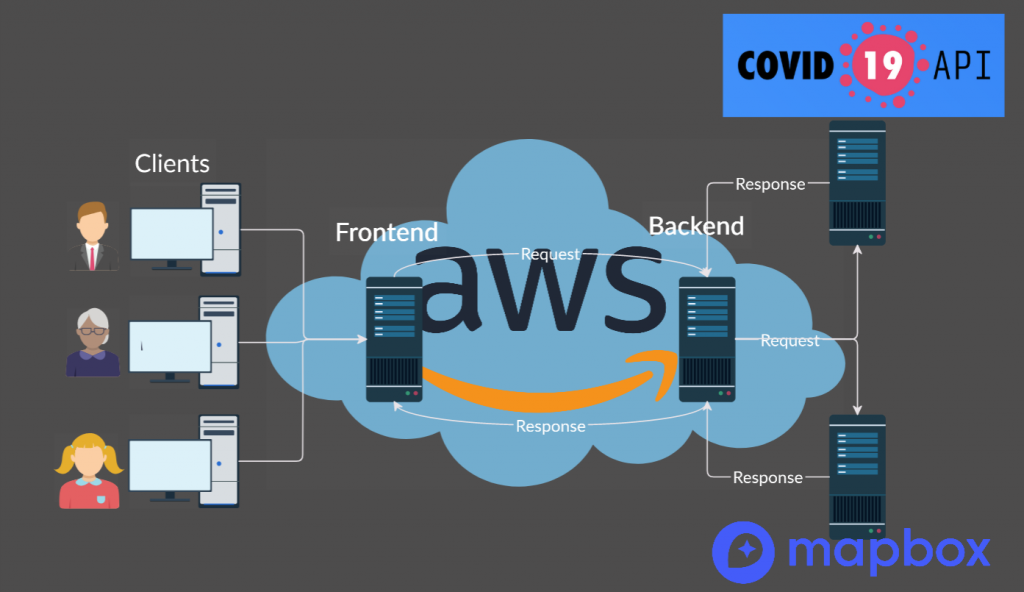
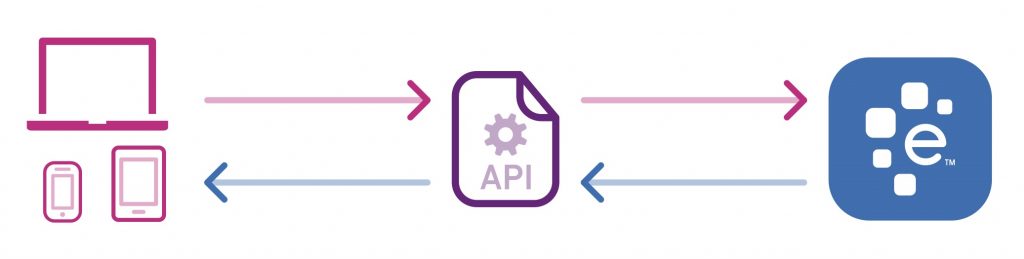
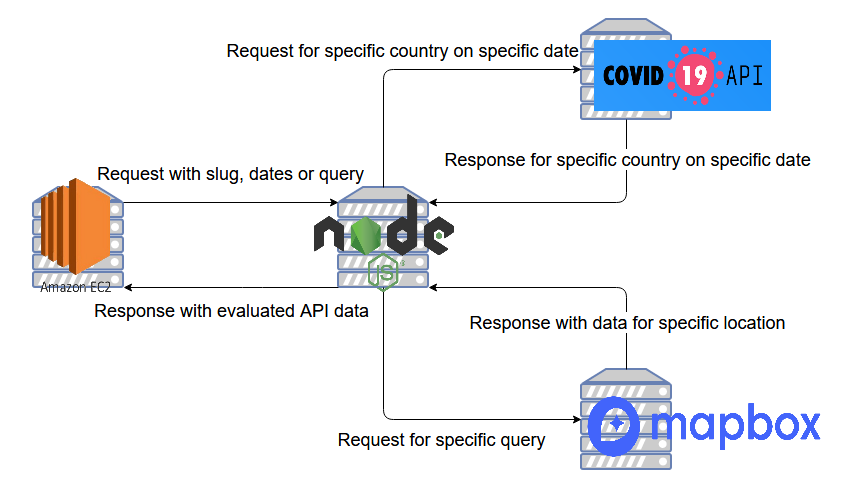
Let’s take a step back and focus more on which solution I came up with for my project. The architecture of my web application is pretty straight forward. Clients can access a frontend via their browser. If a client hovers over, clicks on or searches for a country, a HTTP-Request is sent to the backend server which then evaluates that request and sends another HTTP-Request to either the COVID-19-API or the Mapbox-Search-API depending on what the client requested. Upon receiving a HTTP-response from either one of the APIs backend systems, my backend server evaluates the data for the respective user request and sends it back to the frontend where it is then visualized. I will go a little more in-depth about these topics later on, but first I want to explain why having a separate frontend and backend makes sense.
Pros for having a separate front and backend:
- It’s far easier to distinguish between a frontend or backend issue, in case of a bug
- Possibility to upgrade either one without touching the other as they run on different instances (modularity)
- Allows use of different languages for front- and backend without problem
- Two developers could work on each end individually without causing deployment conflicts, etc.
- Adds security, because the server is not tightly bound to the client
- Adds level of abstraction to the application
Cons for having a seperate front and backend:
- Have to pay two cloud instances instead of just one
- Independent testing, building and deployment strategies required
- Can’t use templating languages anymore, instead the backend is basically an API for the frontend
6. Frontend
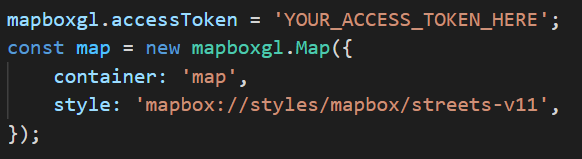
The frontend of my application consists of a static HTML-website that is hosted on an AWS EC2 Linux instance. The EC2 instance gets its data from an S3 bucket that is also hosted in AWS and contains up-to-date code for the website. The implementation of Mapbox is very straight forward. All you have to do is implement the Mapbox CDN(Content Delivery Network) into the head and include the above shown code with a valid access token into the body of your HTML. The “style” tag allows the user to select from different map styles, such as streets, satellite, etc. Users can create custom map styles, tilesets and datasets using Mapbox Studio. The big benefit of this is that the user does not have to store and load the data manually from the server. Instead a user can simply upload a style/tileset/dataset to Mapbox Studio and access it from the HTML by creating a new data source with the respective url for the style/tileset/dataset.
In my case I created a custom tileset from a GeoJSON file of every country in the world. You can find geographical GeoJSON data for free online, I personally found this handy web tool that lets the user create a fairly accurate GeoJSON from countries of choice. But I encountered a problem by doing so. Even though I had fairly accurate geographical data for each country, the COVID-19-API does not support every single country. By sending a request to the COVID-19-API I got a list of all supported countries with their respective country-slug and ISO2 country code. Since those country codes are unique I wrote a basic algorithm that would craft a custom GeoJSON from all matching country codes of both the GeoJSON and the country JSON response.
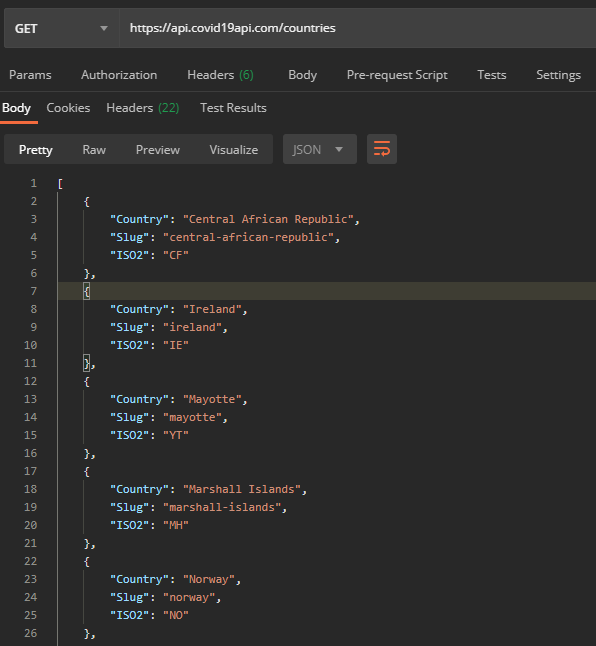
Unfortunately not everything was that easy, because for some reason not every Object in the GeoJSON had a valid ISO2 code. So I had to manually go through all countries of both files and figure out which ones are missing, which was a real pain in the backside. Eventually I had a simple GeoJSON with a FeatureCollection containing a name, a unique slug, a ISO2 code and a geometry for each country, which I then uploaded to Mapbox Studio as a custom tileset.
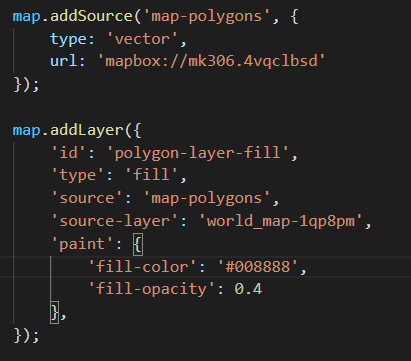
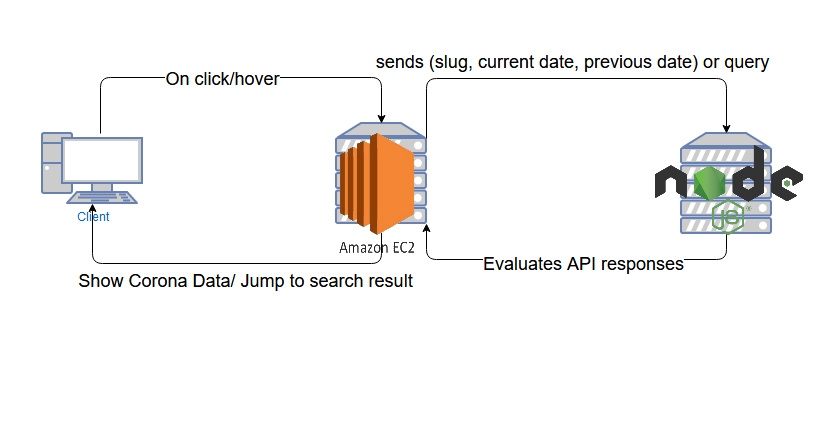
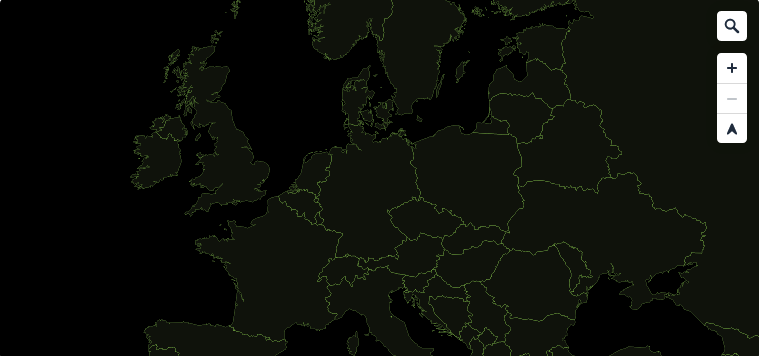
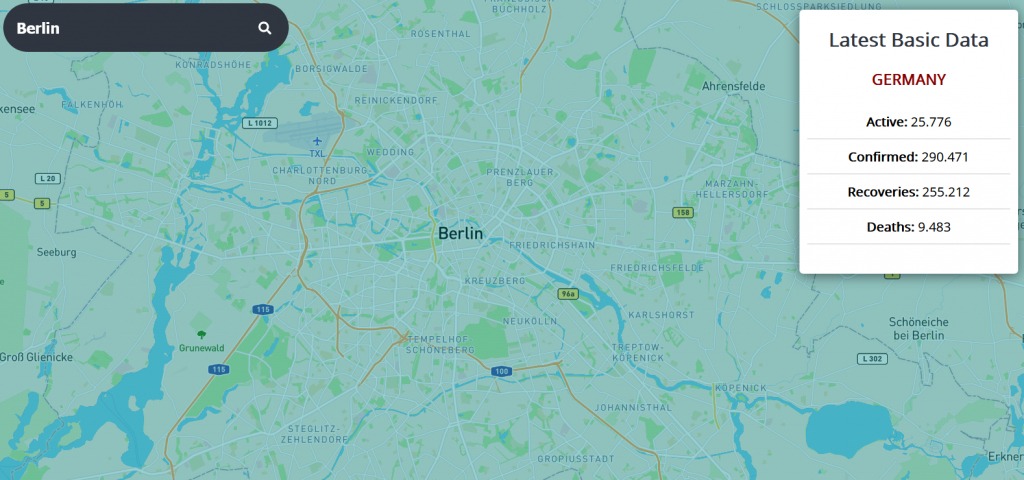
Now that my tileset was uploaded to Mapbox studio, I was able to create a data source and a style layer from it. This allowed me to customize the appearance of the tileset’s polygons to my liking. By using Mapbox’s map.on() function, I could add hover and click events for when the client hovers or clicks over a country and retrieve information from the tileset for this specific country(feature). In my case I get the slug for the country the user has clicked or is currently hovering on and start a HTTP-Request to the backend server with this information and the current and previous date. Hovering will return a basic COVID-19data for a country, while clicking will return premium data.
6.1 COVID-19 Data Request (Frontend)
The request is sent using the fetch method, which is a JavaScript interface. The body of the POST-request contains the country slug for the country you want to get COVID-19data for, the current date and the date of the day before. This information is needed for the backend request from the COVID-19-API in order to get the latest corona-related data.
After receiving a response from my backend in the form of a JSON object, the data is added to an empty <ul> object in the HTML where it is then visible to the client.
6.2 Search Request (Frontend)
The search function works very similar to the previous description on how the COVID-19 data is requested, but instead of sending dates and a country slug from the tileset, we send a query. This query is the text that the client enters into the search bar. Upon starting a search, a fetch POST-request is sent to the backend containing the query in its body. After receiving a response from the backend which contains information about the first point of interest the Mapbox geocoder could find, we jump to the location of the POI, as long as it was a valid query. This “jump” is handled from the Mapbox fitBounds() function which tries to fit a POIs bounding box perfectly on the user’s screen.
7. Backend
The backend consists of a single Node.js express server that is hosted in an Elastic Beanstalk instance on AWS. I also added a CI/CD Code Pipeline from AWS that connects the instance to a GitHub repository so I have continuous updates. Since I decided on separating my frontend and backend, the backend server behaves much more like an API system for my frontend.
7.1 COVID-19 Data Request (Backend)
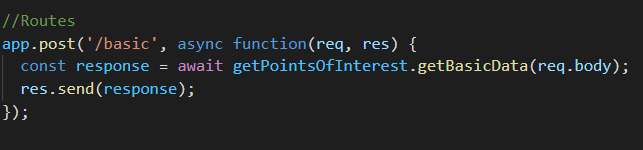
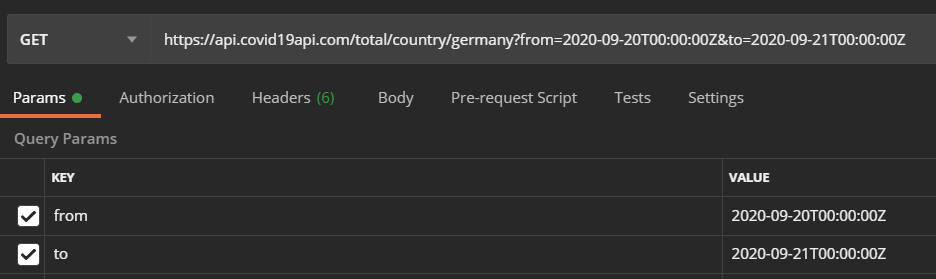
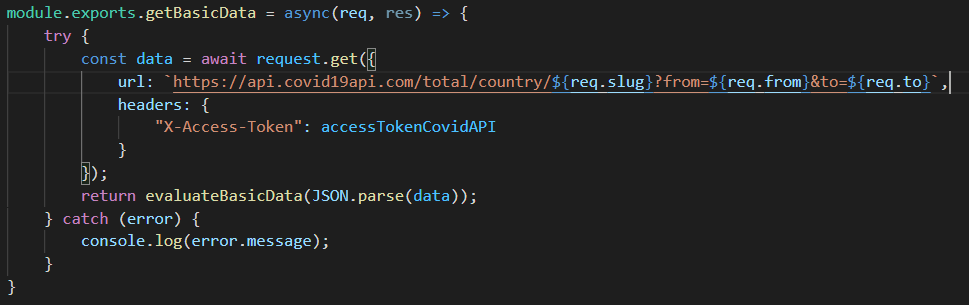
Whenever a HTTP-Request for one of the corona-related server routes happens, the server passes the request body to a function and executes this function. Upon execution, the backend sends another HTTP-Request to the COVID-19-API with the country slug, the current and previous date as parameters and the API access token as header. This request is being sent using the request-promise npm dependency.
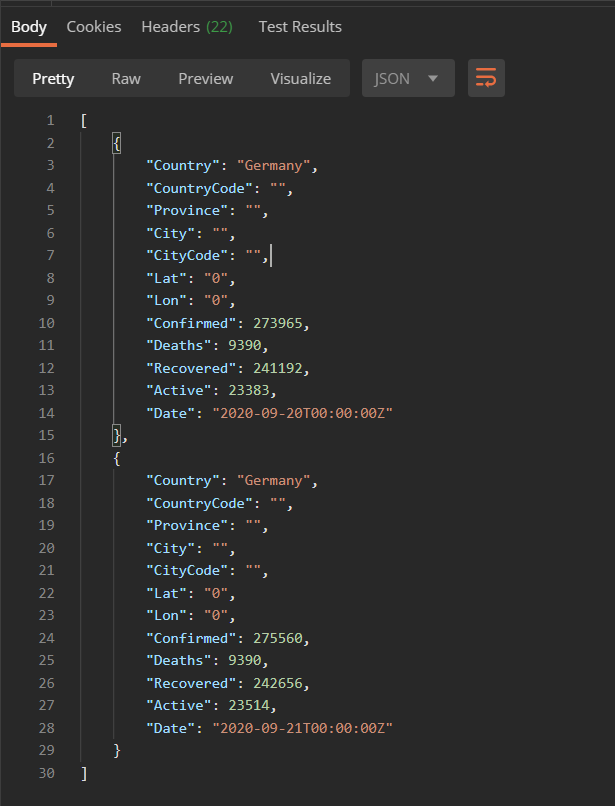
The COVID-19-API’s response contains specific, corona-related data for the requested country. This data has to be evaluated and adapted, to make sure the backend only responds with data that is needed and correctly formatted. This is necessary, because otherwise larger Integer numbers are difficult to read without a dot every 3 numbers. After evaluation the data will then be sent back to the frontend where it is then displayed.
A problem that I stumbled upon while working on the backend was that the requested data was only usable within the scope of the callback function. In order to fix that issue and prevent an empty string from being sent to the frontend as a response, I had to learn about promises (async and await). Let’s go back to the restaurant example, shall we? If you create a function in JavaScript it is synchronous by default. That means a waiter would take an order from a table(client) and gives it to the kitchen. If the system was synchronous, the waiter would wait in the kitchen(server) for the chef to be done preparing the order and not serve any other tables in the meantime. He will not serve another table until he brings the finished food to the table which has ordered. As you can see, this would be very inefficient, which is why asynchronous exists. The exact same scenario would work as followed if it was asynchronous: The waiter would take an order and give it to the kitchen, but instead of waiting in the kitchen he would start serving other tables and bring the finished food as it is ready to be served. In the case of my application it is important that I handle requests asynchronously, because there are multiple requests per second when a client hovers over many countries in a short period of time. And that is where the JavaScript keywords async and wait come into play. Async defines that a function is asynchronous and await can be used in the scope of an async function to make sure to wait until a HTTP-request is finished and the response has arrived. This makes sure that the COVID-19-API’s response and not an empty body will be sent to the frontend.
7.2 Search Request (Backend)
If there is a HTTP-Request for a query search, the server simply starts a request to the Mapbox Geocoding API with the request body’s query and the Mapbox access token as parameter. The result will be a list of POIs that fit the query, but for the sake of simplicity the server always sends the very first result back to the frontend.
8. Other Challenges
Another challenge that occured during my work on the project was that I sometimes struggled finding a solution for a problem, because documentation for an API or a service wasn’t clear or simply not existing. Sometimes it would take multiple hours reading up on documentation and community contribution, just to figure out that a single line of code would fix the problem. The biggest issues I probably had with the AWS and COVID-19-API documentation. While I could fix the issues I had with AWS by following YouTube and StackOverflow tutorials, there wasn’t really such a thing for the COVID-19-API. I then joined the official slack server for the API and reached out to the creator and developer who was very supportive and helpful.
9. Conclusion
Cloud computing is versatile and complex. During my time working on the project I got a far better understanding about web applications, APIs and cloud computing as such. I got more confident in working with JavaScript as a frontend and backend language and made my first steps into the world of web and cloud development. I learned a lot about location-based data and server architecture as well as how to do research on these topics. When I look back on what I achieved with this project, I am very happy with the result. I managed to reach all the goals I set for yourself. I’m also happy that I decided to go with AWS over Azure for this project, because I got to work with a new cloud environment. For my next cloud-based web application I probably will go back to Azure though or try a new cloud service, as I am not a big fan of the AWS documentation and management console.
But now it is up to you what you do with this information. Are about to close your browser in disappointment after not learning about the latest Coronavirus numbers or are you going to work on your own cloud-based web application tomorrow? No matter how you decide, I hope you learned something from reading this blog post that will help you on your journey to become a cloud developer.
Thanks for reading!
Leave a Reply
You must be logged in to post a comment.