End user monitoring is crucial for operating and managing software systems safely and effectively. Beyond operations, monitoring constitutes a basic requirement to improve services based on facts instead of instincts. Thus, monitoring plays an important role in the lifecycle of every application. But implementing an effective monitoring solution is challenging due to the incredible velocity of changes in the IT landscape and because there is no silver bullet applicable for everyone. This post outlines the basics of monitoring on a strategic level and focuses on some practical facets, so you can derive a concrete solution well adapted for your unique needs and circumstances. The first part covers monitoring principles followed by monitoring tactics for web-based applications. This post concludes by pointing out major challenges you will probably face when implementing a monitoring solution.
Monitoring principles
Before we can establish basic monitoring principles and strategies we must clarify the term monitoring and examine its purposes in more detail. This entails the differentiation of monitoring and observability.
Definition
To begin with, there are generally accepted definitions of monitoring, but they are abstract and hardly tangible because they originate from systems theory. Aiming to demystify monitoring, we take definitions into account which are provided by recognized practitioners. They help us to understand the gist of monitoring.
Greg Poirier applies the official definition of observability which states that a system is observable if you can determine the behavior of the system based on its output. He terms a system as a set of connected components and the way a system acts as its behavior. Thus, the outputs of a system are the concrete results of its behavior. He derives his definition of monitoring thereof [1]:
“Monitoring is the action of observing and checking the behavior and outputs of a system and its components over time”
The key element is that we actively observe the behavior of a system over time. James Turnbull describes monitoring in his book Monitoring with Prometheus as the tools and processes used to measure and manage technology systems. This represents the technology perspective, but he states that in addition monitoring provides information to the business by translating the gathered data into a measure of user experience. Consequently, monitoring can be used to increase the value the service provides its customers. This characterization highlights the importance of monitoring to ensure user satisfaction with direct consequences on the organization’s competitiveness [2].
The authors of the book Site Reliability Engineering offer a more practicable definition of monitoring [3]:
“Collecting, processing, aggregating, and displaying real-time quantitative data about a system, such as query counts and types, error counts and types, processing times, and server lifetimes.”
In addition to the previous definitions, the authors mention that monitoring requires gathering of information about systems in real-time. They summarize the purpose of monitoring concisely by saying that a monitoring system should address two questions: What is broken, and why?
Goals and Motivation
The characterizations of the term monitoring indicate the purposes and goals we can achieve with a monitoring system. Let us zoom out to fully understand the underlying motivation of monitoring. The ultimate goal of every organization is to satisfy customers by maximizing the value its products provide to customers. This is a basic requirement to ensure the competitive advantage. In an ideal world an organization conducts a continuous cycle consisting of a build, measure and learn stage to improve the products. In his book The fifth discipline Peter Senge emphasizes the importance of the last stage by stating that learning faster than the competition is an organization’s only sustainable competitive advantage [4].
Monitoring occupies an important role in this cycle because it powers the second stage “measure” and aids to translate collected data into valuable information in the third stage. This loop is deeply ingrained in the lean philosophy because it implements the continuous improvement of services. Moreover, this cycle establishes a culture which values informed decisions based on data and favors them over instincts or guts. The necessary data is collected through experiments derived from hypotheses. In short, monitoring allows to measure the business value of a system and its components.
To satisfy customers, we need to measure their experience while using the service. Conducting forms of usability tests in a laboratory environment constitutes one possible solution. But this approach does not account for the real customers that generate revenue by using the service in production. A monitoring solution enables us to measure their experience and thereby follow the principle the crowd is the truth. Observing the behavior of users in production is an incredibly valuable source of information and allows to increase the immediacy of feedback. It enhances the significance of the results derived from experiments since they originate from real users. Moreover, the principle of fast feedback is key to accelerate the velocity of an organizations develop-and-release cycle. Another potential of monitoring lies in its ability to help us anticipate future requirements.
In essence, the build-measure-learn cycle is powered by the principle that we cannot improve what we cannot measure. Thus, this well-known rule justifies the existence of monitoring from the business perspective.
The second and more obvious “customer” of a monitoring system is the technology department responsible for developing and operating the services. Since we expect our applications to fail we naturally require a system that observes the health of our services and informs us in the advent of unhealthy conditions. It is supposed to tell us, preferably before customers are affected, what is broken and why. Furthermore, it guides us when we must respond to incidents. It helps us to debug errors, profile software components and plan for the future. In short, monitoring is a mandatory requisite for effectively building, operating and managing systems [2].
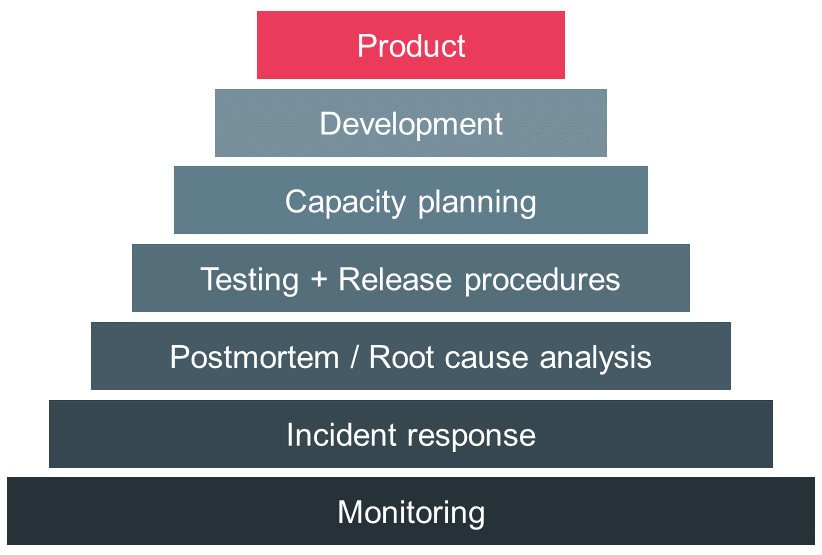
The authors of the book Site Reliability Engineering developed a hierarchy describing their understanding of factors that increase the reliability of services. As you can see in Figure 1, monitoring is the most basic component in their reliability pyramid and enables incident response and postmortems. When we understand what causes problems in our services we can take steps to prevent them. This includes quality assurance of software and adequate release procedures followed by capacity planning. Finally, we can design and develop services adjusted to our unique circumstances and needs. This results in a product which ingrains reliability [3].
Monitoring and Observability
With the beginning of this decade a debate arose around the trending term observability, its meaning as well as its relationship to the established and longstanding concept of monitoring. To fully grasp this discussion, we must shed some light on the evolution of the way we build and operate systems. At the beginning of this century, we manually deployed software on a few long-lasting physical servers. Thereafter, we scaled the systems in accordance with the ever-increasing demand which fostered the need for more automation. With the ongoing rise of containers, orchestrators, microservice architectures, serverless etc. the distribution of systems grows, and the infrastructure becomes more and more ephemeral. Moreover, every layer in the application stack tries to abstract failure away to achieve the reliability target. This results in less explicit failures, e.g. server is down, and increasingly more implicit failures, e.g. higher latency or seemingly random misbehavior. Since every tier in the stack tries to hide failure from the overlying layers, implicit failures are less tangible and more difficult to debug [5,8].
Naturally, the monitoring systems were adapted continuously to this paradigm shift. Because the traditional understanding of monitoring could not cope with the novel requirements, the term observability entered the stage. I belief that the subsequent debate on monitoring and observability was productive and the community developed a generally accepted understanding of both terms. Baron Schwartz summarizes the gist nicely [9]:
“Monitoring tells you whether a system is working, observability lets you ask why it isn’t working.”
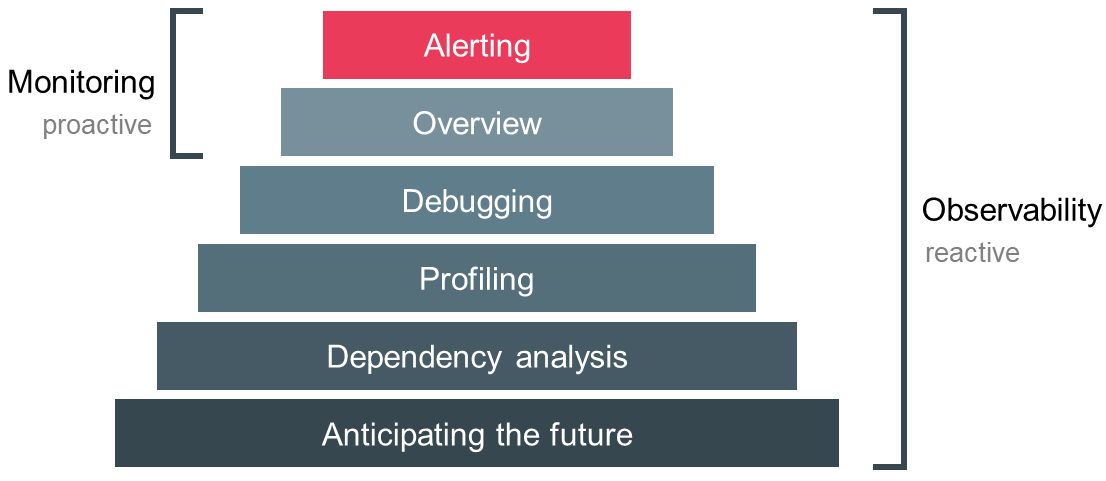
The distinction between both terms is less origin-driven, i.e. where does the data come from, and more purpose-driven, i.e. what are we doing with the data. Figure 2 depicts the pyramid of different purposes we encounter when developing and operating distributed systems. The main goal of monitoring is to keep a bird’s eye view on the overall health of the system and to derive alerts based on symptoms. Observability is a superset of monitoring and provides transparency into the behavior of a system and helps us to generate valuable insights by providing rich context information. This enables debugging of implicit failures, profiling of components, dependency analysis and finally anticipating future requirements. Monitoring is an activity we do proactively, hence we generate information from the collected data all the time. In contrast, observability is conducted by an engineer on demand and generates the information on the fly [6,7,8].
Finally, both terms differ in the sense that monitoring is an activity whereas observability can be viewed as a property of a system. When we build systems with observability in mind, we acknowledge that complex systems are unpredictable and never fully healthy. We embrace failure and accept that it is impossible to predict every failure set. Lastly, we value the ease of debugging and belief that it is an absolute requisite to effectively develop and operate robust systems. In summary, monitoring and observability are not adversaries but complementary in their pursuit of different goals [8].
Principles
Upon establishing a basic understanding of monitoring we can explore guiding principles that help us to tailor an effective monitoring solution.
To begin with, we can distinguish two perspectives of the monitoring system relative to the monitored service: blackbox and whitebox monitoring. In case of blackbox monitoring we observe a system from the outside and thereby examine a system from a user’s perspective. This approach is a valuable source to identify symptoms. Exemplary techniques are continuous pings to a service or tracking page load times of artificial requests. In contrast, whitebox monitoring analyzes a system from the inside by taking the internals of the system into account. This is better suited to anticipate future developments and expose triggers of failure. Logs, metrics and traces emitted from internal components are prominent examples of whitebox data sources [8].
Similar to the distinction between blackbox and whitebox monitoring there are two types of traffic available to generate the information from: synthetic and real user measurement (RUM). The former approach creates artificial load to simulate different test conditions. This classifies as blackbox monitoring and can be applied automatically without any user interaction, e.g. during a Continuous Integration pipeline. Unlike synthetic monitoring, the RUM approach uses actual traffic caused by real users under real conditions. This whitebox approach will be the center of a typical monitoring strategy because it is the only way to realistically assess the impact of the application’s state on the user experience. Hence, we can derive relevant business metrics [5,11].
Every monitoring system should answer two questions: what is broken, and why? It is important to differentiate symptoms and causes to create a monitoring solution with maximum value and minimum noise. For example, serving http requests with status code 500 is a symptom possibly caused by a database which refuses connections. Especially in a multitier system this distinction becomes highly relevant since a symptom in one layer can be the cause in another layer [3].
Monitoring is a form of quality assurance and can generate information about the availability, performance and functionality of a system. Depending on whether we observe the service during development or production, a monitoring solution can help us to a different extend. Whereas measuring availability and performance are typical uses cases of monitoring systems, verifying functionality is more difficult. We can capture for example http status codes, JavaScript errors in the browser or application error logs but it can be illusory to merely rely on such sources without considering what response data users actually receive [12].
According to Cindy Sridharan’s seminal blog post Monitoring in the time of cloud native there are three basic sources of data: logs, traces and metrics. She describes logs as an immutable list of discrete events recorded over time. They are easy to generate and offer valuable information with substantial context. The high granularity of logs leaves us with overwhelming amounts of log data which requires further processing for them to be of avail. Both, traces and metrics are aggregations of logs but along orthogonal axes. Traces reveal the end-to-end path of a particular request in a distributed system by aggregating the series of causally-related events invoked by the request. Traces allow to identify bottlenecks in the entire flow of a request. Metrics are according to the Cambridge dictionary “a set of numbers that give information about a particular process or activity”. They are a numerical representation of data typically as time-series. Hence, we can take full advantage of mathematical modelling and statistics to translate metrics into information. Compared to logs and traces, metrics are well suited for storage, processing, compression and retrieval [6,8,13].
With respect to data collection, we can differentiate two strategies: push and pull monitoring. Let’s assume we have a central monitoring server and many distributed hosts with a monitoring agent installed. With the former approach every agent sends its data proactively to the central server. In contrast, in the pull model the monitoring server requests the data from every agent periodically. There is an ongoing debate on the benefits of both techniques especially concerning scalability, usability and security [5].
Finally, it is advisable to adopt a structured approach to identify relevant pieces of information. For example, Google uses its four golden signals to derive metrics with maximum value: latency, traffic, errors and saturation. There are other valid methods like USE or RED, too. The important aspect is that we reason about what information is valuable to us in order to reduce the noise in our monitoring solution.
Monitoring stack and metrics
We conclude this chapter on monitoring principles by introducing another one, which I belief is the most important one. To begin with, let’s look at a typical monitoring stack as depicted in Figure 3. At the top we can see the business metrics which indicate the value of the service to the organization, e.g. revenue, number of paying customers, active users, costs per customer etc. One tier below in the stack we measure the user experience. This helps us to understand how users actually interact with our service. Exemplary metrics can be the usage of features, user journeys, perceived load time, number successful or failed logins and so forth. The subjacent layer is more technical-oriented and comprises information the frontend application or user agent expose, e.g. total page load time, time to first byte, time to render the page, JavaScript errors etc. If we descend another tier we encounter the backend application including external services like caches and databases. Relevant metrics can be response times, error rates, traffic volumes, cache hit rates, database connection rates etc. In the layer below we monitor the components that the backend applications run in. This encompasses operating system metrics like CPU, RAM and disk as well as runtime, virtualization, containerization and cluster management information. In the two lowermost tiers we observe the actual server hardware and physical networks.
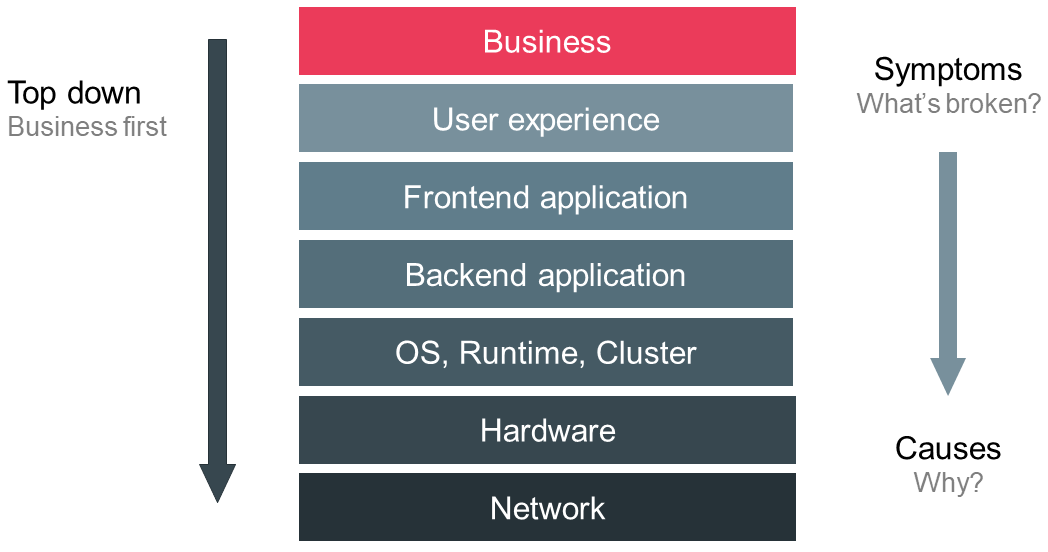
Information generated from data collected at higher levels in the stack is less granular and more symptom-oriented whereas the lower tiers help to identify causes at higher granularity. This leads us to the most fundamental principle: monitor top down meaning business first. Observing a system at a high level provides an immediate insight into the actual state of the service and addresses the most crucial question: Are our users impacted? Answering this question forces us to put the top down strategy in combination with monitoring from the user’s perspective at the center of our monitoring solution thereby maximizing its value and minimizing noise [5].
Monitoring tactics
In the previous chapter we introduced fundamental design patterns, so we are now equipped to explore common tactics to monitor our services. We will focus on techniques concerning web-based frontend and backend applications.
Please keep in mind that you should always start with business metrics. But because identifying important business telemetry deserves an entire book let me just say that these metrics should measure how your organization performs with respect to figures the company has chosen to adequately represent the health of the business as a whole [5].
Frontend monitoring
The frontend application is often missing in many monitoring solutions despite its undisputed relevance to gauge user experience. Remedying this blind spot is crucial especially amidst the shift from thin to thick clients in form of single page applications. Remember that frontend monitoring aims to collect data exposed by the frontend application itself or the user agent, so we can better understand the interaction of users with our service and their experience. To do so, we have two techniques at our disposal: synthetic monitoring and real user measurement. These approaches are not adversary but fit perfectly together.
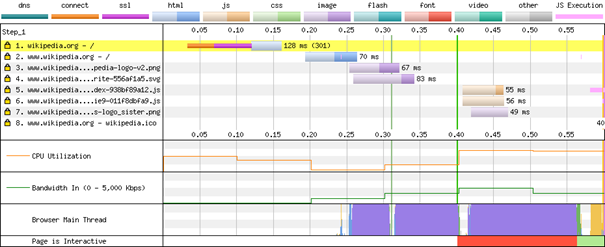
As stated above, in case of synthetic monitoring we create artificial requests under a variety of conditions and observe relevant metrics without any knowledge about the internals of the system. A prominent open source tool is webpagetest.org which is maintained by Google. You basically enter the URL of the website under review, specify test conditions like connectivity, location etc. and the tool assembles rich diagnostic information, e.g. load time, time to first byte, and illustrates relevant events in a detailed waterfall graph as shown in Figure 4. Additionally, the tool takes screenshots until the website is fully loaded so you can analyze how the browser composites the website. A similar, also well-known tool is sitespeed.io which is designed to be integrated in continuous integration pipelines.
In case of real user measurement, we apply a whitebox approach, hence we need to instrument our code manually. There are many software-as-a-service (SaaS) vendors offering tailored code snippets, but you can enhance the frontend application yourself. Collecting the data in the browser is not enough because you need a backend as a central server to gather, store, process, query and display data from all users. In frontend monitoring we mainly rely on logs and metrics as data sources. Traces are less relevant because frontend application are monoliths.
Logging in JavaScript is mostly used during development and debugging on the developer’s local machine. But effectively using JavaScript logs in production offers a wealth of valuable information. Logs can achieve basic supervision of what’s going on in the user’s browsers. We can track important events and primarily provide ample context. Collecting logs of all users facilitates the investigation of issues reported by real customers. A central log management enables adequate support because logs vanish with a page refresh and you cannot expect users to open the browser console and send the logs manually to your tech team. A well-known SaaS platform for managing frontend JavaScript logs is loggly.com.
Logs can be leveraged to identify bottlenecks or pain points in your frontend application experienced by real users. Moreover, logs allow to profile users to a certain degree with data provided by the browser. You can track for example click paths, user journeys, the user agent, operating system, location, battery level, referrer etc. Prominent tools are Google Analytics and Matomo (formerly known as PIWIK). Out of personal experience I cannot emphasize the importance of error tracking enough. Not only can JavaScript errors render your application completely or partially unusable, but you probably won’t see these impairments directly in your backend monitoring. Moreover, the users most likely don’t get direct feedback in the advent of an error. This causes frustration and dissatisfaction on the part of your users. Finally, we can aggregate logs to metrics to optimize for storage and processing.
Modern web browsers offer plenty of data that can be used to measure the performance of a website. The API recommendations are specified by the World Wide Web Consortium (W3C). The main advantage of these APIs lies in their remarkable accuracy and reliability compared to formerly used JavaScript-based libraries. The global performance interface is the entry point for all performance related APIs. The High-Resolution Time API defines the performance interface and provides a highly accurate timestamp allowing precise measurements. The Performance Timeline API extends the performance interface and defines a PerformanceEntry interface and three methods to retrieve these entries. Everything we measure is a performance entry. The Resource Timing API provides detailed network timing data concerning all resources of the application. It exposes timestamps for every stage in loading phase: redirect, app cache, dns, tcp, request and response.
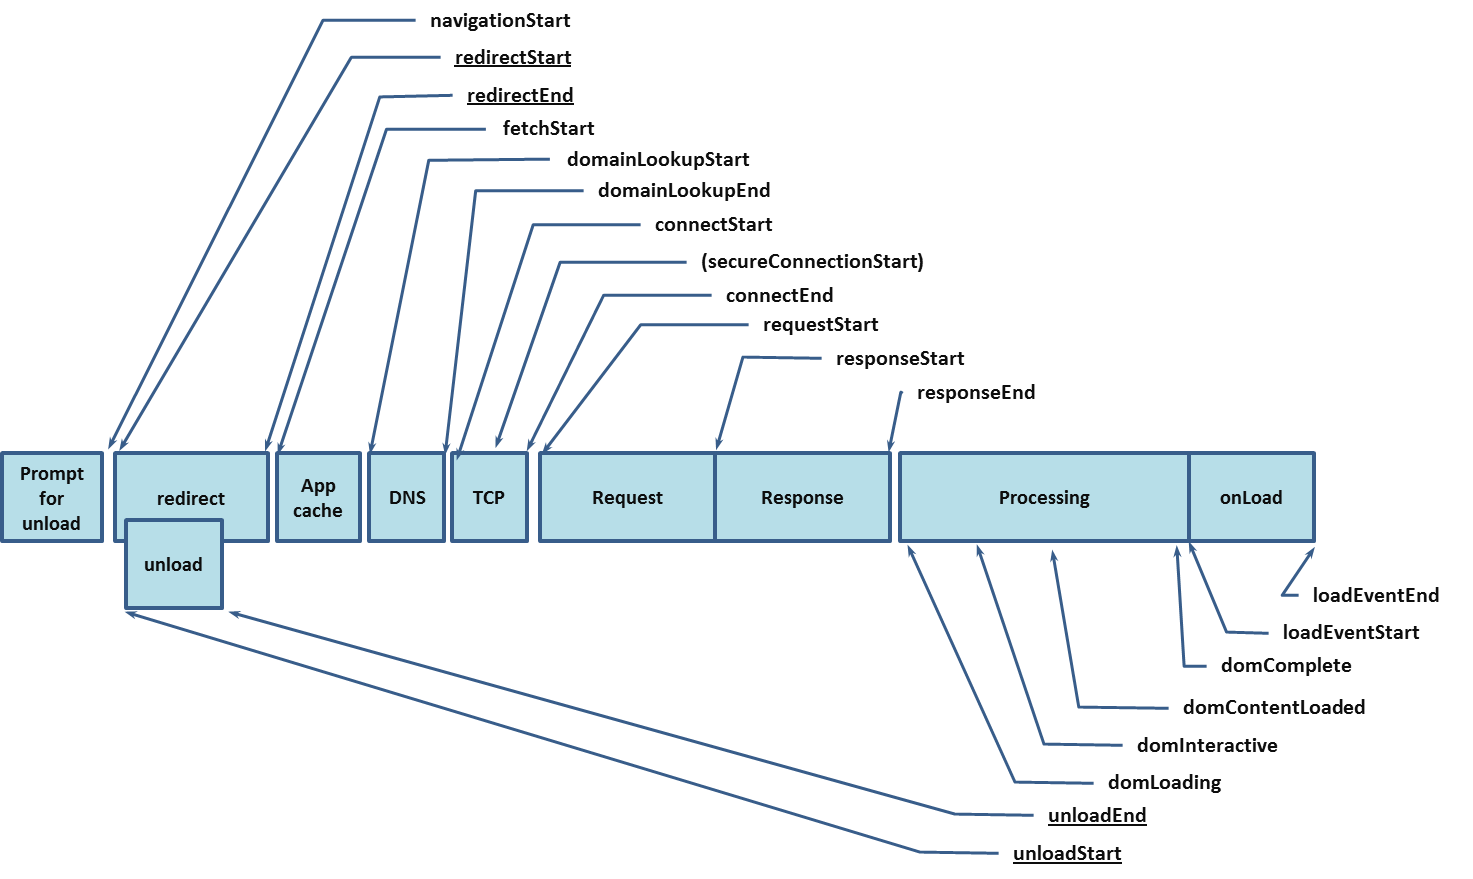
The Navigation Timing API extends the Resource Timing API but focuses on the document instead of its resources. The API exposes data regarding the process of converting requested resources into rendered pixel. Figure 5 depicts the timing events available in the Navigation Timing API. Since all events are timestamps we need to subtract events enveloping the time period we want to measure. Among other useful interfaces is the User Timing API which allows to define custom performance entries in the application. The W3C offers a roadmap of future performance monitoring specifications [5,14-22].
Backend monitoring
Instrumenting the backend application unleashes a rich pool of information we can leverage to better understand and improve our services. If we recall the typical monitoring stack, we know that the backend application is in the middle region. Hence, monitoring this tier can identify symptoms and provide useful information to find the triggers. We strive to observe the performance of individual request but also keep track of the service’s overall health at a glance. Applying the four golden signals, i.e. latency, traffic, errors and saturation, guides us towards actionable metrics with minimum noise. These metrics can be used for alerting in case of critical situations and can be subject of reports. Reports can for example address the question whether we have met our service level agreements or availability targets. Moreover, we want to understand the usage and especially the performance of dependencies such as databases, caches, queues, storages and all other external services. Analyzing slow requests and profiling code sections or components aides to identify bottlenecks. Tracing requests through all components in a distributed architecture has the same purpose. Finally, we are in the need of detailed information in case of errors and during the investigation of undesired behavior. This includes next to stack traces enough context information to reproduce the original conditions. Please keep in mind that we can encounter a wide spectrum of backend architectures from single monoliths to highly distributed systems and nowadays serverless functions with a lifetime of seconds or less. Consequently, you need to adapt your monitoring solution to your specific system design.
The application of blackbox techniques in backend monitoring is limited hence we focus on whitebox methods. To begin with, we have logs as a valuable source of information which protocols the behavior and actions of the application. Determining the minimum amount and elaborateness of logs required to properly operate and improve a service without creating impenetrable volumes of data is challenging and will probably take many iterations. As an engineer, you can always ask yourself: if something goes wrong what information is really needed to remedy this issue.
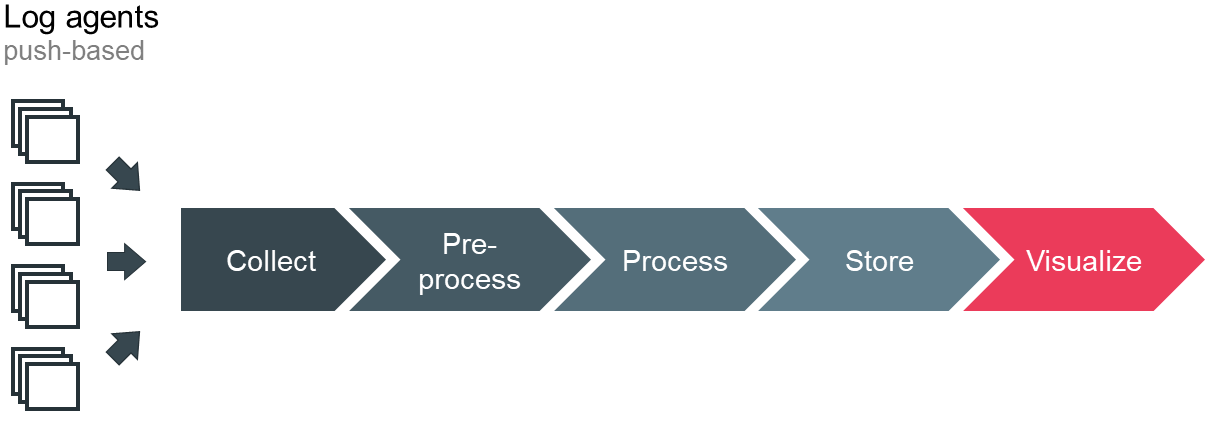
Unfortunately, instrumenting your code so it emits valuable log data is not enough. You will see that a central log management becomes an absolute necessity to efficiently analyze your log data. With an increasing scale and distribution, you need a system that automatically collects, processes and stores the generated data, as depicted in Figure 6. Additionally, the system must support sophisticated searches across your logs and offer proper visualization. Because you want to collect, query and analyze you logs in almost real time, you face a stream processing problem. Studying the relevant theory is advisable. Since your log management is crucial for operating the production cluster – specifically in case of abnormal situations – and you might have short-lived services, you want it to be highly available even in the advent of load or traffic spikes. These requirements are not easy to satisfy and require a lot of engineering efforts. Especially the proper handling of spikes with back pressure or queues is challenging because more users cause even more logs. You can build your own log management for example with the open source elastic stack or rely on SaaS vendors such as loggly or datadog.
When instrumenting code there is always tension whether a piece of information should surface in a log or as a metric. As a rule of thumb, you can ask how much context you need to interpret the data and translate it into relevant information. There are different approaches to add metrics to your code. You can for example leverage built-in functionality provided by your server-side framework or generate the data yourself and aggregate it with tools like statsd. You can basically count the occurrences of an event, i.e. increase a counter if a certain section in your code is executed, and time the duration of single statements or code blocks. Tools like statsd aggregate the data and are capable to emit statistics like mean, minimum, maximum, median, percentile ranks etc. There are many push- or pull-based tools to collect, store and process the generated metrics such as Prometheus and graphite. A widespread tool to visualize data is Grafana.
In addition to exposing metrics, it is a common design pattern to incorporate a dedicated http endpoint in every service to provide information on the health of the application. The response can be comprised of relevant meta information like the build version or role and the status can be determined by different factors such as connectivity checks to external dependencies [5,23].
In case of a distributed architecture incoming requests often span multiple services. Thus, we need to reconstruct the ample flow that transactions take as they traverse through a distributed system. OpenTracing as a project of the Cloud Native Computing Foundation tries to specify a single, standard mechanism to instrument code of applications, libraries and services independent of vendors or languages. Basically, every incoming request is tagged with an ID. As the request propagates across the distributed system, every component emits log data and tags the entries with the ID of the invoking request. A tracing tool collects the logs and assembles the flow of a request by using the ID. As a result, you can see the elapsed time the request spent at every component along with additional context information. Exemplary tools are zipkin and jaeger [24].
Conclusion
So far, we have established fundamental principles and explored basic tactics to better understand our systems. I’d like to conclude this post by pointing major challenges you will likely face when implementing your own monitoring solution.
To begin with, you should keep in mind that there is no silver bullet in monitoring because every organization is unique within its environment and its products. This means that you must establish a lasting process to continuously adapt your monitoring solution to your particular situation, needs and circumstances. Because of the maxim “standing still is a step back” you will adjust your business model and services you offer unceasingly to maximize their value to your customers. Hence, you identify relevant indicators as well as attune your applications and infrastructure accordingly. This entails that you adapt your monitoring solution. Additionally, it is advisable to keep up with current trends in the IT landscape to ensure your competitiveness. Besides, you should strive to continuously increase the value the monitoring system provides to your team. This includes for example to minimize the noise in order to reduce stress the teams are exposed to. Alert fatigue is a typical symptom of noisy monitoring systems.
Unfortunately, identifying relevant indicators is not enough. You need to find an appropriate technique to retrieve, process, store and display this information. Remember that the same intelligence can surface in different data sources. Therefore, it is crucial to collect the right data from the right components in your system. Moreover, choosing a reasonable resolution of your data is challenging as well. You need to balance accuracy and timeliness and, on the side, and the resulting volumes of data on the other side.
The lean philosophy encourages to reach decisions based on facts and feedback instead of instincts. Hence, a corporate culture is required which values reliable information and transparency. Because every member of an organization is part of its value proposition increasing the observability of the entire value stream must be a responsibility shared by everyone. This includes every department from business, sales, development, QA to operations, security etc. As a requisite, everybody must belief in the value of observability.
The requirements of every department can add up to a very complex monitoring system which might exceed everything we can accomplish with reasonable efforts. Furthermore, adding complexity results in a more fragile system and entails additional maintenance. Overcomplicated monitoring systems with little transparency suffer from impaired usability and foster distrust because decisions are less apparent. Consequently, keeping the entire monitoring solution with its rules, e.g. for alerting, simple and comprehensible will increase the reliability, the trust placed in the system and finally enhances its acceptance among the employees. Opting for simplicity entails regular housekeeping, e.g. data source that are collected but not used are up for removal.
As mentioned before, scaling the monitoring system poses not only a technical but also an organizational challenge. From the technical perspective, we face on the side huge databases full of time-series data to track metrics and massive volumes of log and trace data we need to process close to real-time. On the other side, we rely on the monitoring system to be highly available and responsive even amid traffic spikes. Because monitoring servers are exposed to failure as well, we need mechanisms such as data replication and redundant servers to guarantee reliability. Concerning the organizational perspective, creating a collective responsibility shared by many teams across all departments becomes challenging. However, a shared system can create dependencies between teams which might throttle their velocity.
We have to elaborate more on scaling because this requires considerable automation to be efficient. Automation with respect to monitoring is mandatory because at a certain scale it is out of question to perform basic tasks manually, e.g. adding new hosts or subsequently updating dashboards or alerting rules. Consequently, you are in the need of a tool that supports automation. Moreover, you want your monitoring tools to communicate with other systems via APIs mainly because there is currently no single tool that can satisfy all your monitoring needs entirely.
Finally, we face the challenges caused by current trends such cloud native and even richer single page applications. Ephemeral systems and the shift of increasingly more logic to browsers force us to revise our current monitoring systems. Moreover, in the foreseeable future we will probably be overwhelmed by the amount of data our excessively scaled systems produce. Hence, we need to think of new approaches to handle this traffic and still derive valuable insights. Maybe we will find the solution in machine learning.
As a closing statement I’d like to emphasize that a monitoring system itself is not very useful. The value of a monitoring solution depends on the business value we derive from it.
Related sources
Content
- https://vimeo.com/173610062 (latest access: 17.07.2018)
- J. Turnbull. Monitoring with Prometheus. v1.0.1. Turnbull Press, 2018.
- Beyer et al. Site Reliability Engineering: How Google Runs Production Systems. 1st. O’Reilly Media, Inc., 2016.
- P. Senge. The Fifth Discipline: The Art and Practice of the Learning Organization. Doubleday/Currency, 1990.
- M. Julian. Practical Monitoring: Effective strategies for the real world. 1st. O’Reilly Media, Inc., 2017.
- https://medium.com/@copyconstruct/monitoring-in-the-time-of-cloud-native-c87c7a5bfa3e (latest access: 25.07.2018)
- https://medium.com/@copyconstruct/monitoring-and-observability-8417d1952e1c (latest access: 27.07.2018)
- C. Shridharan. Distributed Systems Observability: A guide to building robust systems. 1st. O’Reilly Media, Inc., 2018.
- https://www.vividcortex.com/blog/monitoring-isnt-observability (latest access: 22.07.2018)
- https://www.vividcortex.com/blog/monitoring-analytics-diagnostics-observability-and-root-cause-analysis (latest access: 22.07.2018)
- https://calendar.perfplanet.com/2011/a-practical-guide-to-the-navigation-timing-api/ (latest access: 25.07.2018)
- https://www.youtube.com/watch?v=c-MwrS_PfHQ (latest access: 26.07.2018)
- https://medium.com/@copyconstruct/logs-and-metrics-6d34d3026e38 (latest access: 25.07.2018)
- https://w3c.github.io/hr-time/ (latest access: 26.07.2018)
- https://w3c.github.io/performance-timeline/ (latest access: 26.07.2018)
- https://w3c.github.io/resource-timing/ (latest access: 26.07.2018)
- https://w3c.github.io/navigation-timing/ (latest access: 26.07.2018)
- https://w3c.github.io/user-timing/ (latest access: 26.07.2018)
- https://developer.mozilla.org/en-US/docs/Web/API/Resource_Timing_API/Using_the_Resource_Timing_API (latest access: 26.07.2018)
- https://developer.mozilla.org/en-US/docs/Web/API/Navigation_timing_API (latest access: 26.07.2018)
- https://w3c.github.io/perf-timing-primer/#navigation-timing (latest access: 26.07.2018)
- https://developer.mozilla.org/en-US/docs/Web/API/User_Timing_API (latest access: 26.07.2018)
- https://codeascraft.com/2011/02/15/measure-anything-measure-everything/ (latest access: 27.07.2018)
- https://medium.com/opentracing/towards-turnkey-distributed-tracing-5f4297d1736 (latest access: 27.07.2018)
Images
Figure 1: https://landing.google.com/sre/book/chapters/part3.html#fig_part-practices_reliability-hierarchy (latest access: 30.07.2018)
Figure 2: https://medium.com/@copyconstruct/monitoring-in-the-time-of-cloud-native-c87c7a5bfa3e (latest access: 30.07.2018)
Figure 4: https://www.webpagetest.org (latest access: 30.07.2018)
Figure 5: https://www.w3.org/TR/navigation-timing/#processing-model#processing-model (latest access: 30.07.2018)
Leave a Reply
You must be logged in to post a comment.