In order to display a website as quickly as possible, performance optimization is necessary. Since manual optimization can be time-consuming and often several steps need to be performed, automating performance optimization can be a good idea. This in turn can include, for example, reporting (speed analysis of the website) and performance optimization itself (compression, code reduction, …).
This article gives an overview of where automation can be used, which tools are suitable for this and what these tools offer.
Why even Optimize?
Being able to view and interact with a website as quickly as possible – a requirement that many users have nowadays. According to a Google study, 53% of users leave a page if it takes longer than 3 seconds to load [1]. A slow website also has a negative impact on search engine optimization.
Conversely, a fast website means more views, a longer dwell time and a more likely return of customers. This in turn can generate higher sales, for example.
tl;dr
- Website loads too long: Fewer visitors, less revenue
- Website loads quickly: More visitors, more sales
Automation Benefits
Benefits for Reporting
For reporting, automation offers time savings. Instead of manually going to a website or tool and running the analysis there, this step can be included in the workflow. The results can be better monitored and provide timely feedback, as, for example, the impact of changes can be made directly visible through the reports. Another benefit is the comparability of results over time, which in turn makes improvements or deteriorations more visible. Once a script has been created for execution and configured accordingly, many combinations can be tested quickly. This includes various parameters such as end device, platform, location and network connection. While running these manually would take a lot of time, the script can perform these steps all with one click or via a trigger. Last, such a script is easily repeatable. For example, there is a certain security after changes, since the impact can be reviewed immediately.
Benefits for Performance Optimization
Automation can also save time in terms of performance optimization. If steps such as image optimization or compression are incorporated directly into the workflow, there is no need to worry about forgetting this step once new files are created. With manual optimization, the individual steps can quickly become boring and monotonous, especially if they have to be performed frequently. A script doesn’t care if it performs the same task over and over again. The workload of the developer is reduced and focus can be turned back to developement of the actual application.
tl;dr
- Time saving
- Can be integrated into the workflow
- Timely feedback
- Comparison over time possible
- Test many combinations in a short time
- Relieves
What to Automate
Automate Reporting
The first step is to find out where optimization is possible. Tools such as PageSpeed Insights, WebPage Test or Lighthouse are suitable for this.
With WebPage Test and PageSpeed Insights, the website to be tested can be checked using the URL, while Lighthouse is included in the ChromeDev tools and analyzes the website currently being called up if required. Depending on the tool used, values such as First Contentful Paint (FCP), Time to Interactive, Largest Contentful Paint (LCP) and Cumulative Layout Shift (CLS) are returned. In addition, recommendations provide starting points for optimization.
At the latest, if you want to check your website multiple times, even calling the tools and manually entering the address can become annoying. It is much more practical to include this procedure in the build process. This also has the advantage that messages or warnings can be sent automatically if specified, critical values are exceeded. One of these values can be a defined performance budget, for example, which is checked every time. If a report is generated regularly, it is easier to see whether performance has improved or deteriorated. Pages can therefore be evaluated over time.
Automate Performance Optimization
The more requests are sent to a page and the larger these requests are, the slower the page loads. Compression and minimization can be used to counteract this. It is also possible to combine several requests. For example, HTML, CSS and JavaScript files can be combined. To use cache busting, a file must be uniquely identifiable. This allows files to be stored in the browser cache while ensuring that the most recent file is always used. Instead of laboriously naming files by hand and risking errors, this task can be very well automated. The tasks can all be processed one after the other, even cleaning up the “leftover” files can be done directly afterwards.
In general, performance optimizations can be implemented on the server side in a pre-processing step or at runtime. Although automation offers many advantages, the initial time required to set it up should not be underestimated. In addition, there is the updating and maintenance of the script or scripts. In addition, changes made automatically, such as merging multiple files, should always be checked for unwanted side effects.
tl;dr
- Incorporate already known tools into the build process
- Set up automatic messages/warnings
- Use performance budget
- Use compression, minimization and cache busting
- Combine all tasks in one script and process them one after the other
- Pay attention to the time required
- Still check manually for side effects
Tools
Tools for Reporting
Those who are already used to tools like PageSpeed Insights (PSI) [2] do not have to do without them even with an automated approach. One option is to install PSI as a globally executable tool via Node Package Manager and then use it via the command line [3]. This establishes a connection to the PageSpeed Insights service and generates a detailed report about the performance of the specified page.
$ npm install --global psi
$ psi https://www.demoblaze.com/ --strategy=mobile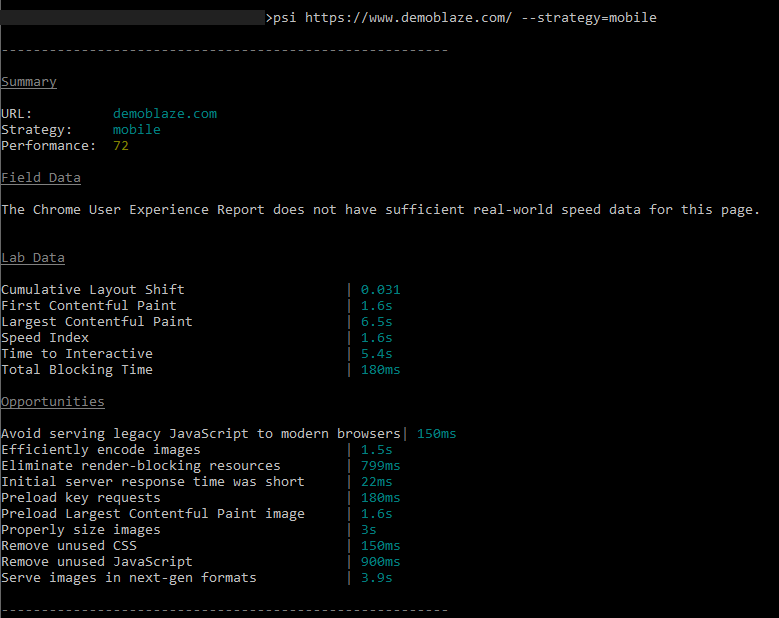
PSI command line 
PSI web interface
Figure 1: Analysis of the DemoBlaze page using PSI in the command line (left) and via the web interface (right).
If you have already set up a workflow with Grunt or Gulp, you can also integrate PageSpeed Insights into it.
Similarly, Lighthouse [4] is available as a CLI (Command Line Interface) [5]. As with PSI, Lighthouse can be conveniently executed via the command line without additional page calls. The advantage here is that the process can also run in the background and the result can be saved in several formats.
$ npm install –global lighthouse
$ lighthouse https://www.demoblaze.com/ --output=json --output-path=./report.json --save-assets
"first-contentful-paint": {
"id": "first-contentful-paint",
"title": "First Contentful Paint",
"description": "First Contentful Paint marks the time at which the first text or image is painted. [Learn more](https://web.dev/first-contentful-paint/).",
"score": 1,
"scoreDisplayMode": "numeric",
"numericValue": 1232.9939999999997,
"numericUnit": "millisecond",
"displayValue": "1.2 s"
},
"largest-contentful-paint": {
"id": "largest-contentful-paint",
"title": "Largest Contentful Paint",
"description": "Largest Contentful Paint marks the time at which the largest text or image is painted. [Learn more](https://web.dev/lighthouse-largest-contentful-paint/)",
"score": 0.14,
"scoreDisplayMode": "numeric",
"numericValue": 5954.400999999999,
"numericUnit": "millisecond",
"displayValue": "6.0 s"
},
"first-meaningful-paint": {
"id": "first-meaningful-paint",
"title": "First Meaningful Paint",
"description": "First Meaningful Paint measures when the primary content of a page is visible. [Learn more](https://web.dev/first-meaningful-paint/).",
"score": 1,
"scoreDisplayMode": "numeric",
"numericValue": 1232.9939999999997,
"numericUnit": "millisecond",
"displayValue": "1.2 s"
},
…An excerpt of the json file created with the above command from the command line
Usage of Testing Frameworks
If, for example, additional tests such as end-to-end tests are carried out in larger projects, it is often possible to use their already established structure. Cypress is an end-to-end testing framework and is able to determine the performance data of Google Chrome and thus find bottlenecks [6]. Selenium, which is normally used for browser automation, can also capture performance data. The so-called HAR file can provide information about performance problems and rendering issues, since it contains, for example, loaded resources and the time required for them. To be able to generate and use this file, the BrowserMob Proxy application must be installed [7]. JMeter is mainly used for running load tests and can be run in Selenium using the JMeter Webdriver Sampler. This can be used to simulate user interactions, for example [8]. If authentication is required to use a page or if a certain state is to be initialized, browser automation can also be used. Alternatives to Selenium include Puppeteer or Playwright. Browser automation can be used to imitate user input such as pressing buttons or entering a mail address in a text field. In combination with the Lighthouse API, automated reports can also be generated, saved and forwarded as required [9].
Crawler
Crawlers collect information about websites and are used by search engines, for example, to create an index. But they can also be used to measure page speed and its performance over time. A crawler can be set up to visit the page in question on a weekly or monthly basis, for example. Depending on the crawler, notifications can be set up to inform about an available report. An overview of different crawlers is linked in the sources [10].
Google Search Console
The Google Search Console [11] is an analysis tool provided by Goole that can be used by registered website operators. It also includes its own speed report, using data from the Chrome User Experience Report. There, summarized metrics on the speed of the page can be viewed and problems can be looked at in more detail. This also makes potential for improvement visible. It is useful that the page speed can also be monitored over time here. You can see whether something has improved or worsened and whether changes have had the desired effect.
Continuous Monitoring
Jenkins (and Hudson)
Continuous monitoring describes the process of constantly monitoring an application. For this purpose, tests are scripted and executed regularly so that the effects of changes can be determined directly. Special CI servers (CI = Continuous Integration) such as Jenkins or Hudson (developement since 2016 no longer continued) are used for this purpose, which can be extended by a dashboard with the help of plugins. This in turn can display the performance of a page in values. Lighthouse can also be combined with Jenkins, for example [12]. Even if your own project is maintained with GitHub, an analysis with Lighthouse can be introduced as an additional step after committing [13].
Google Analytics, Amazon CloudWatch and load testing
Google Analytics [14] provides information about website speed and, similar to tools already presented, shows areas that can be improved and the impact if this improvement is carried out. Amazon offers a tool called cloudWatch [15]. The tool is also used for monitoring and can be set to automatically send notifications when critical values such as site response time are exceeded. Last, load testing and performance monitoring can be performed using tools such as k6. This can be used to collect metrics on how the website behaves when there are many requests, such as how the response time changes. The tests can be created as scripts and executed via the command line [16].
Tools for Performance Optimization
For performance optimization, so-called task runners such as Grunt [17] or Gulp [18] come into question. The idea is the same with both: To automate Tasks, which must be executed again and again manually (minimizing, compressing, optimizing, …). In a configuration file, called “gulpfile” or “gruntfile” depending upon program, the individual tasks are created. This usually includes parameters such as the source of the files, the plugin to be used and the location to which the modified files are to be written. For both taskrunners, there are a large number of plugins that can be used via the tasks, plus releases to gitHub or similar can be automated with them. Differences between the two are minor and shown in the table below.
| Gulp | Grunt |
| Speed advantage, because no temporary files are used | Somewhat slower, since temporary files are used Finished tasks are already defined |
| Consists more of individual building blocks | tasks are more pre-defined |
| 4145 plugins available | 6250 plugins available |
| More flexible | Lower entry barrier |
Table 1: Differences between Grunt and Gulp
Both Grunt and Gulp can be installed with npm as a global executable and as a dependency for the associated project. Plugins responsible for tasks such as minimizing or compressing can be added in the same way. More on this in the next section.
$ npm install --global grunt-cli
$ npm install grunt --save-dev

& npm install --global gulp-cli
& npm install gulp --save-dev
tl;dr
- Install PageSpeed Insights or Lighthouse with npm and use it from the command line.
- (If available) use test frameworks as well
- Use crawlers
- Use Google Search Console
- Using continuous monitoring and available tools, constantly monitor pages
- Set up notifications for critical values or cancel workflow if values fall below critical values
- Include tools like Lighthouse or k6 as a step in the Continuous Integration pipeline.
- Use TaskRunners like Grunt or Gulp to process multiple tasks.
Grunt and Gulp plugin examples
Uglify
gulp-uglify and grunt-contrib-uglify are used to minimize JavaScript files. In the following two examples, the JavaScript files are read from the “src” folder, minimized, and then saved back to the “build” folder.
// Grunt
module.exports = function(grunt) {
  grunt.initConfig({
    pkg: grunt.file.readJSON('package.json'),
      uglify: {
        build: {
          src: 'src/<%= pkg.name %>.js',
          dest: 'build/<%= pkg.name %>.min.js'
        }
      }
    });
  grunt.loadNpmTasks('grunt-contrib-uglify');
};

-----------------------------------------------------------

// Gulp
const gulp = require('gulp');
const uglify = require('gulp-uglify');
const pipeline = require('readable-stream').pipeline;

gulp.task('compress', function () {
  return pipeline(
    gulp.src('src/*.js'),
    uglify(),
    gulp.dest('build')
  );
});
Minimizing CSS
gulp-clean-css and grunt-contrib-cssmin are responsible for minimizing CSS files. The following two examples search for CSS files in the “styles” folder, minimize them, and then place them in the “css” folder (a subfolder of “release”)
// Grunt
module.exports = function(grunt) {
  grunt.initConfig({
    cssmin: {
      target: {
        files: [{
          expand: true,
          cwd: 'styles',
          src: ['*.css', '!*.min.css'],
          dest: 'release/css',
          ext: '.min.css'
        }]
      }
  });
  grunt.loadNpmTasks('grunt-contrib-uglify');
};

-----------------------------------------------------------

// Gulp
const gulp = require('gulp');
const cleanCSS = require('gulp-clean-css');

gulp.task('minify-css', () => {
  return gulp.src('styles/*.css')
    .pipe(cleanCSS({compatibility: 'ie8'}))
    .pipe(gulp.dest('release/css'));
});
Minimizing Images
gulp-imagemin and grunt-contrib-imagemin are responsible for minimizing images. In the following two examples, images are searched for in the “img” folder (subfolder of “src”), minimized, and then placed in the “img” folder (subfolder of “release”).
// Grunt
grunt.initConfig({
  imagemin: {
    dynamic: {
      files: [{
        expand: true,
        cwd: 'src/img',
        src: ['**/*.{png,jpg,gif}'],
        dest: 'release/img'
      }]
    }
  }
});

-----------------------------------------------------------

// Gulp
const gulp = require('gulp');
const imagemin = require('gulp-imagemin');

gulp.task('minify images', () => {
  return gulp.src('src/img/*')
    .pipe(imagemin())
    .pipe(gulp.dest('release/img'));
});
Further exaples
- gulp-concat: Appends/combines files. Can be used to reduce requests
- gulp-minify-html: Minimizes HTML files
- gulp-rev: Adds a hash to files. Can be used for cache busting
- grunt-contrib-compress: To compress files and folders
- grunt-perfbudget: With this plugin a performance budget can be set, using the API of WebPageTest
- grunt-pagespeed: By using this plugin, Google Pagespeed Insights can also be used with Grunt
tl;dr
- Both Grunt and Gulp have a wide range of plugins that can be used to automate performance optimization tasks
Alternatives
Google PageSpeed Modules
It isnpossible to optimize not only on the client side, but also on the server side. The Google PageSpeed Modules [19] provide mod_pagespeed for Apache and ngx_pagespeed for Nginx for data compression, aggregation of similar content, image optimization, and other useful performance optimization features. Web performance best practices are applied to the page and its respective assets such as CSS, JavaScript and images. The modules are based on the PageSpeed Optimization Libraries, which are also open source and anyone can contribute to. The server modules themselves are also open source and are available to everyone. A big plus is that existing content and workflow don’t have to be specially adapted for this.
ROLLUP := ./node_modules/.bin/rollup
ROLLUPFLAGS := --format=iife --sourcemap

JS_DIRECTORY := js
ASSETS_DIRECTORY := assets
JS_ASSETS := $(subst $(JS_DIRECTORY)/,$(ASSETS_DIRECTORY)/,$(wildcard $(JS_DIRECTORY)/*.js))

BABILI := ./node_modules/.bin/babili
BABILIFLAGS := --no-comments

clean-assets:
    rm -rf $(ASSETS_DIRECTORY)/*

$(ASSETS_DIRECTORY)/%.js: $(JS_DIRECTORY)/%.js
    $(ROLLUP) $(ROLLUPFLAGS) -i $< -o $@

build-assets: clean-assets $(JS_ASSETS)

compress-assets: build-assets
    $(BABILI) $(ASSETS_DIRECTORY) -d $(ASSETS_DIRECTORY) $(BABILIFLAGS)
A Makefile for minimizing JavaScript assets. Example by Anton Eprev [20]
npm Scripts
If setting up taskRunners or similar tools is too time-consuming, you can use the node package manager (npm) to create scripts. This has the advantage that the packages (which are often also used by the TaskRunners) can be used directly without having to maintain another layer in between. The node package manager uses the file “package.json” to save dependencies to packages.
{
  "name": "test2",
  "version": "1.0.0",
  "description": "ein weiterer test",
  "main": "index.js",
  "scripts": {
    "test": "echo \"Error: no test specified\" && exit 1"
  },
  "author": "",
  "license": "ISC",
  "devDependencies": {
    "concat": "^1.0.3",
    "imagemin-cli": "^6.0.0",
    "rename-cli": "^6.2.1",
    "uglify-js": "^3.12.8"
  }
}
A simple package.json file, the dependencies result from the install via “npm install [packagename] –save-dev”
The following simple scripts take care of merging JavaScript and CSS files into a new folder, minimizing and copying the images into a new folder, and minimizing the merged JavaScript file. If needed, the folder structure can also be created by executing only this script.
{
  "name": "test2",
  "version": "1.0.0",
  "description": "ein weiterer test",
  "main": "index.js",
  "scripts": {
    "create_directories": "mkdir .\\output\\css && mkdir    .\\output\\js && mkdir .\\output\\img",
    "concat_css": "concat -o output/css/test_concat.css     css/00_general.css css/01_Startseite.css",
    "concat_js": "concat -o output/js/script_concat.js js/script1.js      js/script2.js",
    "concat_all": "npm run concat_css && npm run concat_js",
    "imagemin": "imagemin --out-dir=output/img     bilder/**/*.{png,jpg,gif}",
    "uglify": "uglifyjs -o output/js/script.min.js output/js/script_concat.js",
	"run_all": "npm run concat_all && npm run imagemin && npm run uglify"
  },
  "author": "",
  "license": "ISC",
  "devDependencies": {
    "concat": "^1.0.3",
    "imagemin-cli": "^6.0.0",
    "rename-cli": "^6.2.1",
    "uglify-js": "^3.12.8"
  }
}
The same package.json file with executable scripts. “npm run run_all” runs both “concat_all”, “imagemin” and “uglify” (the scripts can also be called individually)
Monitoring Change
With the node-packet “onchange” files can be monitored and scripts can be executed automatically on changes. npm is more suitable for smaller projects with few dependencies, since the package.json file can quickly become confusing. However, the performance of npm compared to Grunt/Gulp is rather worse [21].
Alternative TaskRunner
If you want alternative TaskRunners, you can use Jake [22], Broccoli [23], Brunch [24] or Mimosa [25]. Lastly, there is webpack and Browserify, both of which are module bundlers. These are primarily used to bundle JavaScript modules into a single JavaScript file that can then be executed in the browser.
With webpack [26], options such as minification and uglification are already included, for which only the “produtcion-mode” must be used. It can also detect the size of CSS files, for example, and minimizes them accordingly. Webpack is also advantageous because of the possibility of “live reloading” or “hot reloading”. In combination with other plugins such as image-webpack-loader, images can be compressed [27].
Browserify [28] works more modularly compared to webpack and goes a lot via plugins, but is also less powerful. It has the advantage of requiring minimal configuration. To achieve optimal results, it is often used in conjunction with a task runner.
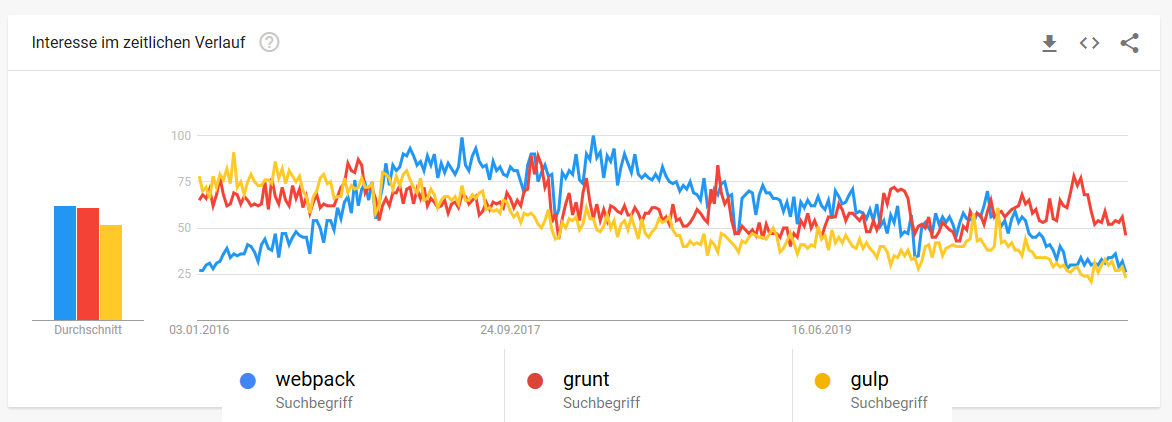
Figure 2: A rough overview of how the search terms have developed in Google Trends.
| Tool | Weekly Downloads (npm) |
| Grunt | 651.050 |
| Gulp | 1.499.532 |
| Webpack | 15.759.207 |
Table 2: Comparison of weekly downloads with the Node Package Manager from Grunt, Gulp and webpack (as of 26.02.2021).
Comparing the search trends and downloads of the much-used tools webpack, Gulp and Grunt, it is not possible to make a precise statement about which of the tools is the most popular, as the terms may also have been Googled in a different context and WebPack can also be used for purposes other than TaskRunner. Nevertheless, it shows that all tools have their raison d’être and are still actively used. Both the blog post “Front-End Performance Checklist 2021” by Vitali Friedman [29] and the blog post “All That Glisters” by Drew McLellan [30] describe that it doesn’t matter which tool you use as long as it achieves the desired result.
tl;dr
- Optimization also on server side with mod_pagespeed and ngx-pagespeed
- use “make” and “makefiles
- use npm scripts
- use webpack and/or Browserify (if necessary in combination with other tools)
- don’t use what is “in”, but what best suits your needs
Provider of ready-made software solutions
If sufficient budget is available, complete software solutions can also be used. Pingdom [31] offers a website speed test that visualizes the website speed and shows performance bottlenecks. Pegasaas [32] advertises an increased PageSpeed score, lower loading times and better sales by using their solution. FastView [33] also offers real-time front-end optimization. Ion [34] offers “intelligent performance optimizations” for web apps as well as Android and iOS apps, and constant adaptation to “content, user behavior, and connection changes.”
Summary
Especially at the beginning of a project, it is worth considering including automation in the project to avoid having to manually perform frequently performed optimization tasks. Reporting and performance optimization can be executed as a series of tasks using task runners and offer many configuration options to adapt them to your own workflow. However, it must be weighed up whether the effort of creating the tasks for the first time (possibly learning the tool) and maintaining the scripts is worth it, or whether performing the tasks manually is faster. The latter might be the case for smaller projects, where setting up such a system might even exceed the effort of the actual project. But even small changes like running PageSpeed Insights from the command line can make the job easier. Alternatives like scripting using npm or webpack are also worth considering. Which tools or which combination of them (webpack + npm, Gulp + Browserify, etc.) is finally used depends on the size of the project, the experience of the team, your own preferences and already existing structures, all of them have their pros and cons. So my recommendation is to familiarize yourself with the tools and their capabilities and try out which setup works best for your use case. Last, there are other best practices that can’t necessarily be automated, such as placing JavaScript links at the end of the document. Therefore, manual optimization should not be ignored in the future.
Quellen
[1] https://www.blog.google/products/admanager/increase-speed-of-your-mobile-site-wi/
[2] https://developers.google.com/speed/pagespeed/insights/
[3] https://github.com/GoogleChromeLabs/psi
[4] https://developers.google.com/web/tools/lighthouse
[5] https://github.com/GoogleChrome/lighthouse
[6] https://techbeacon.com/app-dev-testing/how-do-web-performance-testing-google-lighthouse-cypress
[7] https://dzone.com/articles/performance-capture-i-export-har-using-selenium-an
[8] https://www.blazemeter.com/blog/jmeter-webdriver-sampler
[9] https://www.thehomeofwebautomation.com/automate-lighthouse-audit/
[10] https://www.guru99.com/web-crawling-tools.html
[11] https://search.google.com/search-console/welcome?hl=de
[12] https://kitconcept.com/blog/continuous-performance-analysis-with-lighthouse-and-jenkins/
[13] https://github.com/marketplace/actions/lighthouse-check
[14] https://analytics.google.com/analytics/web/provision/#/provision
[15] https://aws.amazon.com/de/cloudwatch/
[16] https://k6.io/docs/testing-guides/automated-performance-testing
[17] https://gruntjs.com/
[18] https://gulpjs.com/
[19] https://developers.google.com/speed/pagespeed/module
[20] https://eprev.org/2017/02/20/make-as-a-front-end-development-build-tool/
[21] https://deliciousbrains.com/npm-build-script/
[22] https://jakejs.com/
[23] https://broccoli.build/
[24] https://brunch.io/
[25] http://mimosa.io/
[26] https://webpack.js.org/
[27] https://developers.google.com/web/fundamentals/performance/webpack/decrease-frontend-size
[28] http://browserify.org/
[29] https://www.smashingmagazine.com/2021/01/front-end-performance-2021-free-pdf-checklist/
[30] https://24ways.org/2017/all-that-glisters/
[31] https://www.pingdom.com/product/page-speed/
[32] https://pegasaas.com/
[33] https://www.radware.com/products/fastview/
[34] https://www.akamai.com/de/de/products/performance/web-performance-optimization.jsp
Leave a Reply
You must be logged in to post a comment.