Authors:
Max Merz — merzmax.de, @MrMaxMerz
Martin Bock — martin-bock.com, @martbock
The idea of this project was to create a simple chat application that would grow over time. As a result, there would be more and more clients that want to chat with each other, what might lead to problems in the server that have to be fixed. Which exact problems will occur, we were going to see along the project.
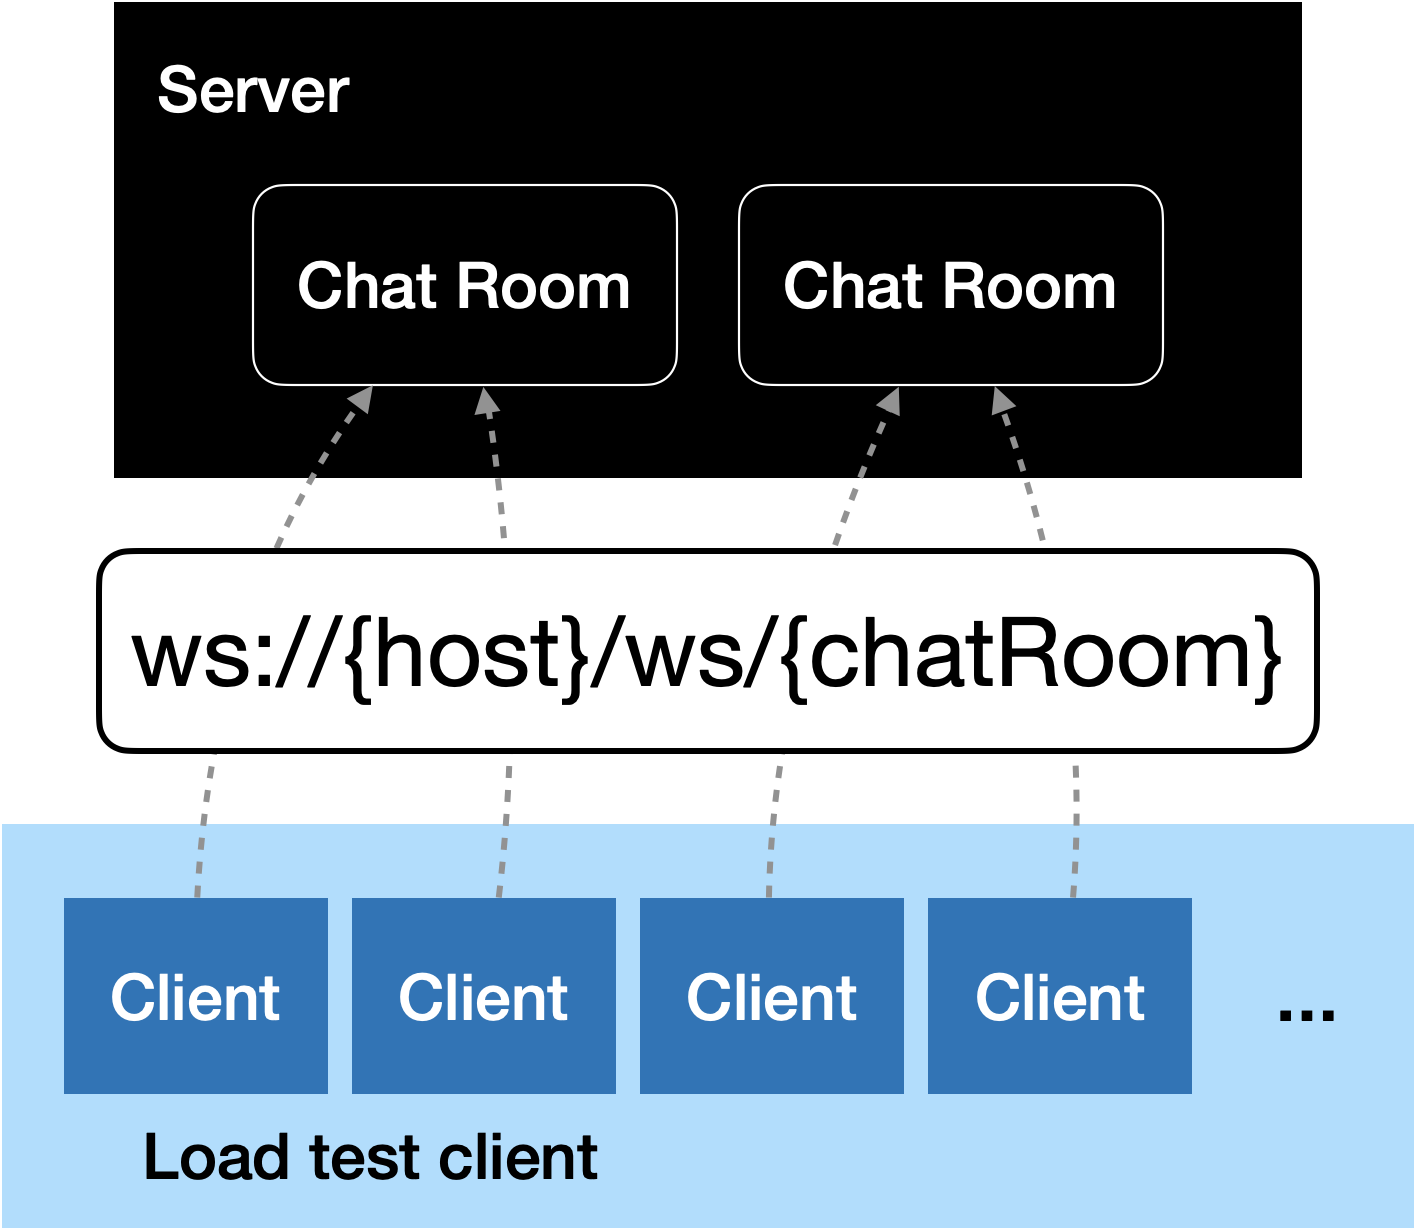
In the center is a simple chat server that broadcasts incoming messages to all clients. In order to notify the clients about new messages, the connection should be static and bidirectional. Therefore, we based the communication on the WebSocket protocol.
Furthermore, wanted to see how the server behaves with the rising load. Therefore, we had the plan of performing several load tests to display the weak points and improvements, as the system enhances.
Creating a Concept for (Monitoring) A Load Test
We started this project with creating an overview over all the things we will need. First of all we needed a client that can be used to chat and a server that is capable of broadcasting messages to all connected clients.
Load Test Client
In order to perform load tests, we need a lot of clients that can send a lot of messages to the server. Since we don’t have a bunch of people that are willing to chat, we have to automate the process of creating and operating the chat clients. Since we wanted to use WebSockets and no public load testing clients were available, we had to implement a load test client by ourselves.
First we implemented a basic chat client that was just there for connecting to
the server and for sending and receiving messages. The first version was just
a basic command line client. The tool asks you for a username and afterwards
you can chat with other clients.
In order to automate the dispatching of the messages, we added a loadTest flag.
Additionally, you can configure the message frequency and size.
To start a bunch of clients at once, we created the load-test-client. Here you can see a screenshot of the flags that can be used to configure the load test client.
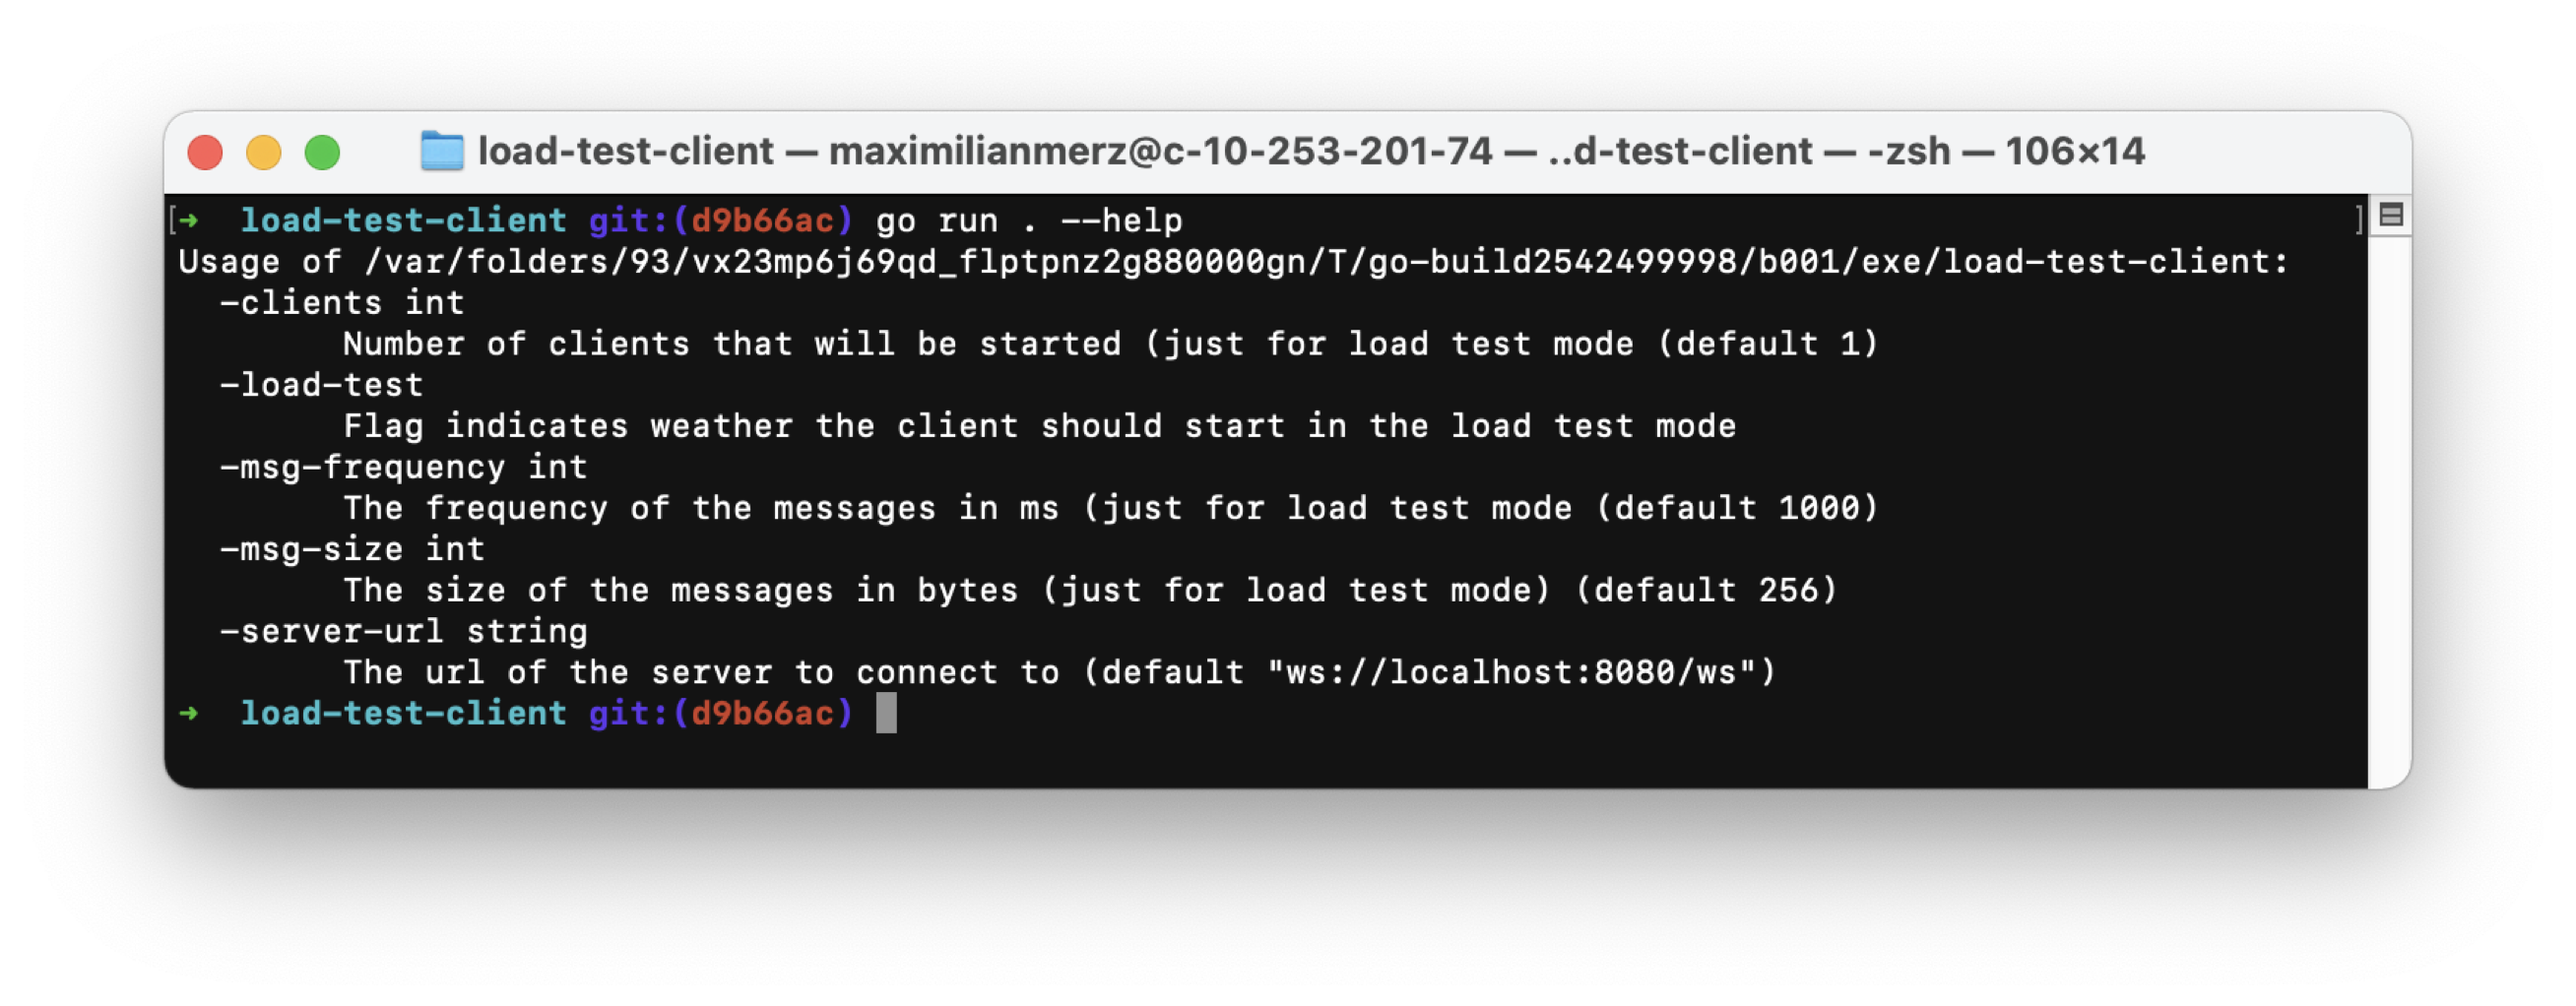
Furthermore, we wanted to collect metrics from the clients that could provide information on the performance of the system in general. The collected data will be written in a CSV file that we can use after each load test to analyze the test by calculating latencies and the ratio of sent vs. received messages, and finally render graphs of the calculation results.
Server Monitoring
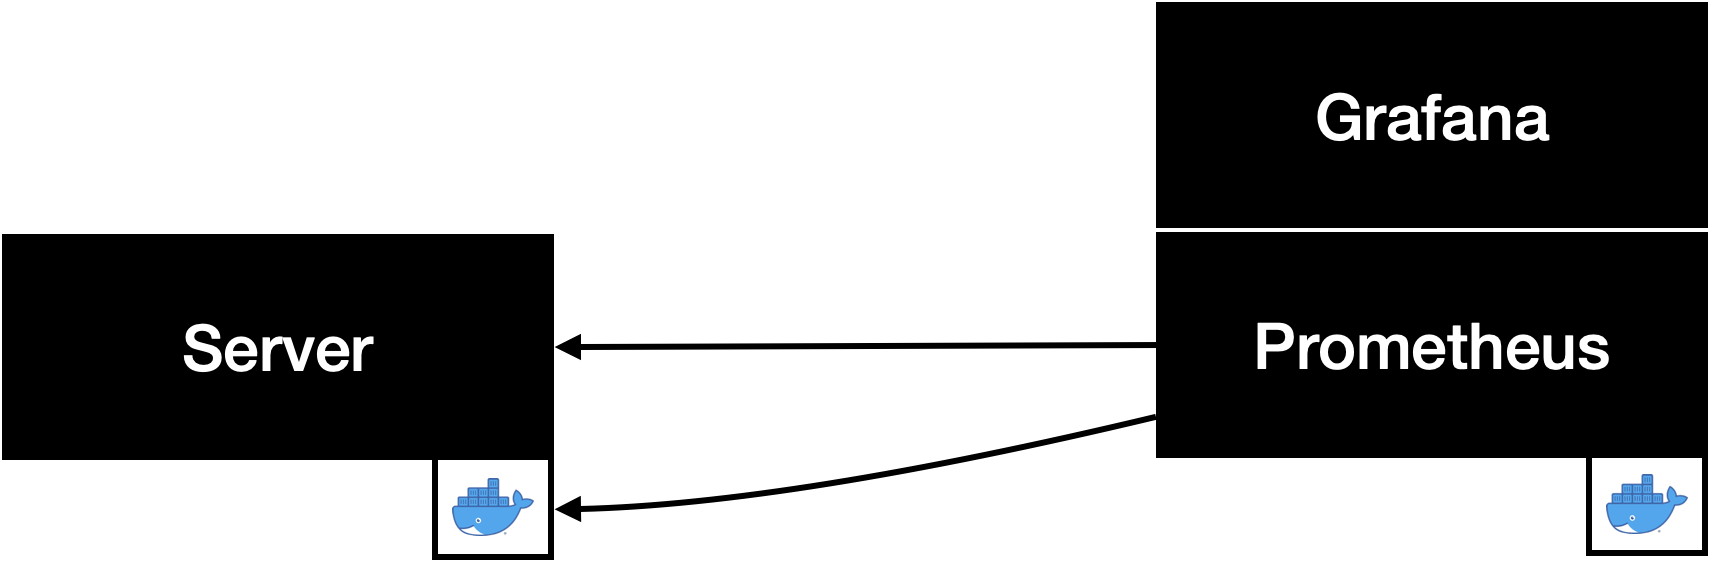
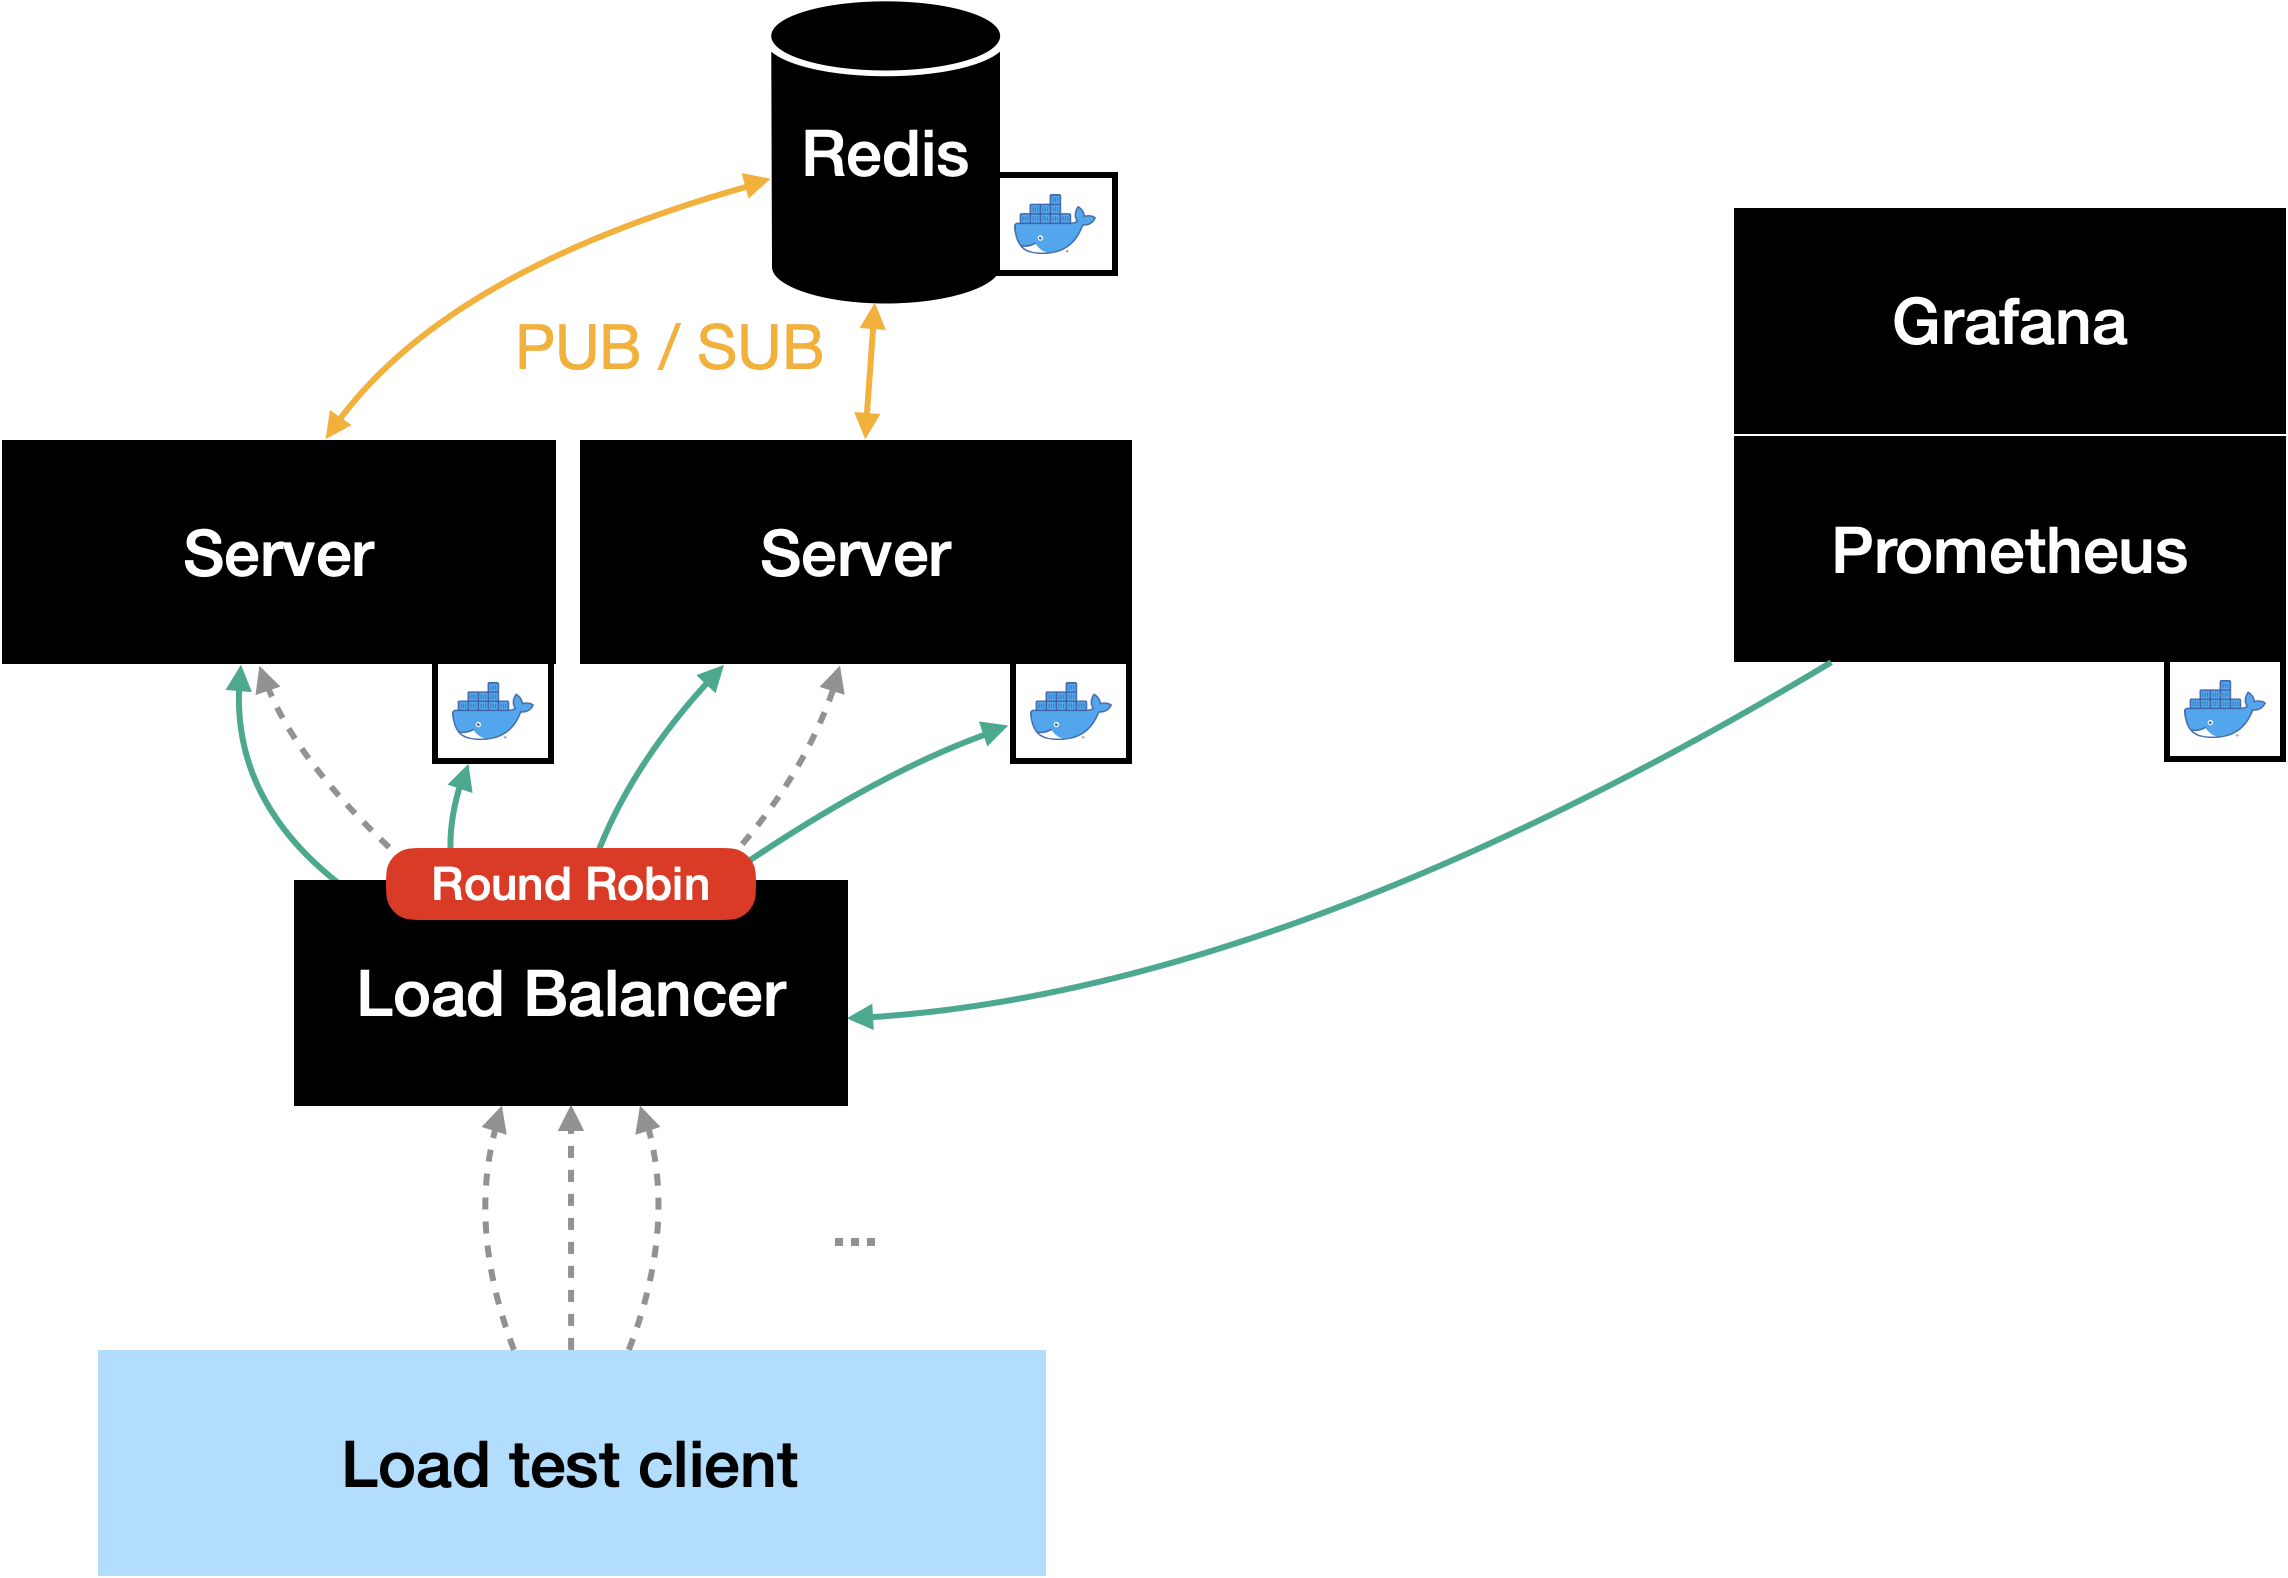
We wanted to monitor the server using the popular Prometheus/Grafana stack. First of all, we used cAdvisor to access the hardware metrics of the docker container that runs the server application. Additionally, we used the Golang client for Prometheus to provide custom metrics. The metrics we wanted to collect were the number of incoming and outgoing messages as well as the processing time (time from receiving a message at the server to sending it to the last client) for each message.
Finally, we configured two Grafana dashboards to display all the collected metrics.
Restricting the server
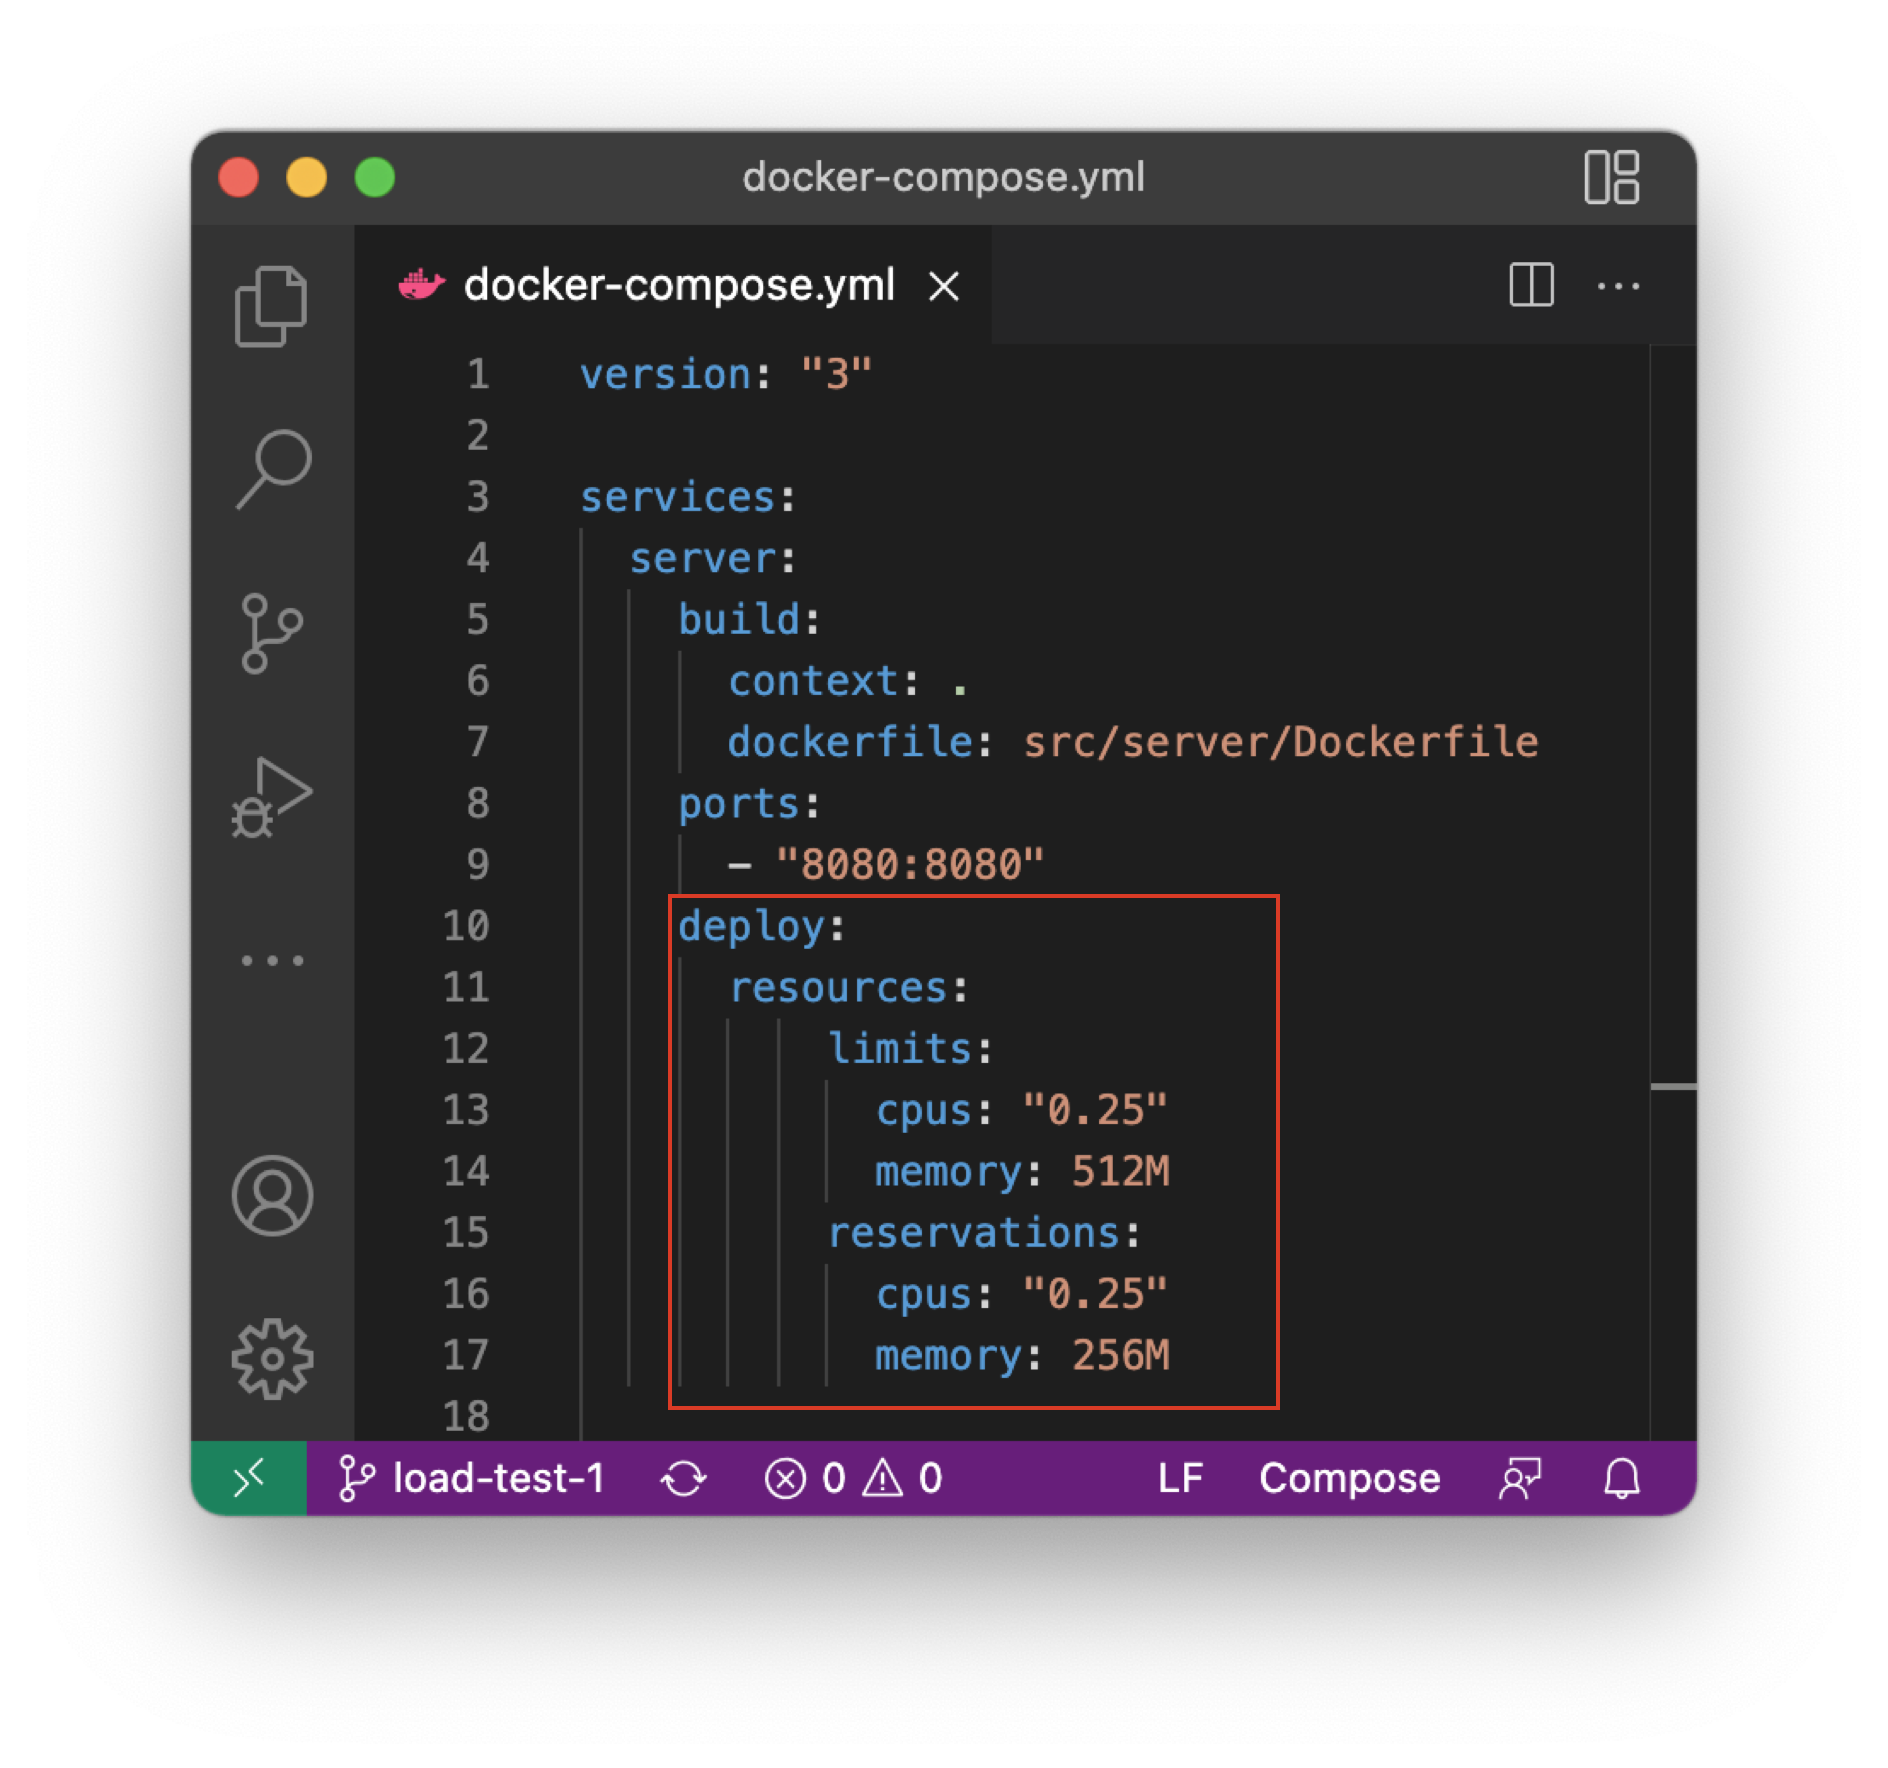
With the intention of running into scaling issues very quickly and only having a limited server capacity available at the university, we wanted to restrict available CPU time and memory. After some research, we found out that there are two possibilities to restrict the resources of Docker containers:
- Docker Swarm
- Kubernetes
Unfortunately, it is not possible to restrict resources using Docker-Compose, which we used up until now. Since we already configured the whole server and the additional monitoring containers in a docker-compose.yml file, we decided to try the Docker Swarm approach because Swarm can also be configured using docker-compose files. This means that we did not have to create a new configuration. Additionally, deploying the server and the monitoring components into a Kubernetes cluster would have resulted in even more work and would have increased the incomplexity.
Learning a New Programming Language
One of the project goals we had was to learn the programming language Go. As it is the case with every new language you learn, there are certain points where you run into problems. This included getting to know some new concepts that we find quite interesting. Of course, we do not want to withhold these.
Goroutines
Within the implementation of the client, we realized that we have to parallelize sending and receiving messages. In other languages you would start them in two threads — but Go has something else: Goroutines.
A goroutine is a lightweight thread in GoLang. It can continue its work alongside the main goroutine and thus creating concurrent execution.
— https://golangdocs.com/goroutines-in-golang
In addition to sending and receiving messages, we used goroutines to parallelize the clients that will be started by the load test client. Running the different operations as goroutines was not that complicated but when stopping the different applications, we stumbled accross several problems.
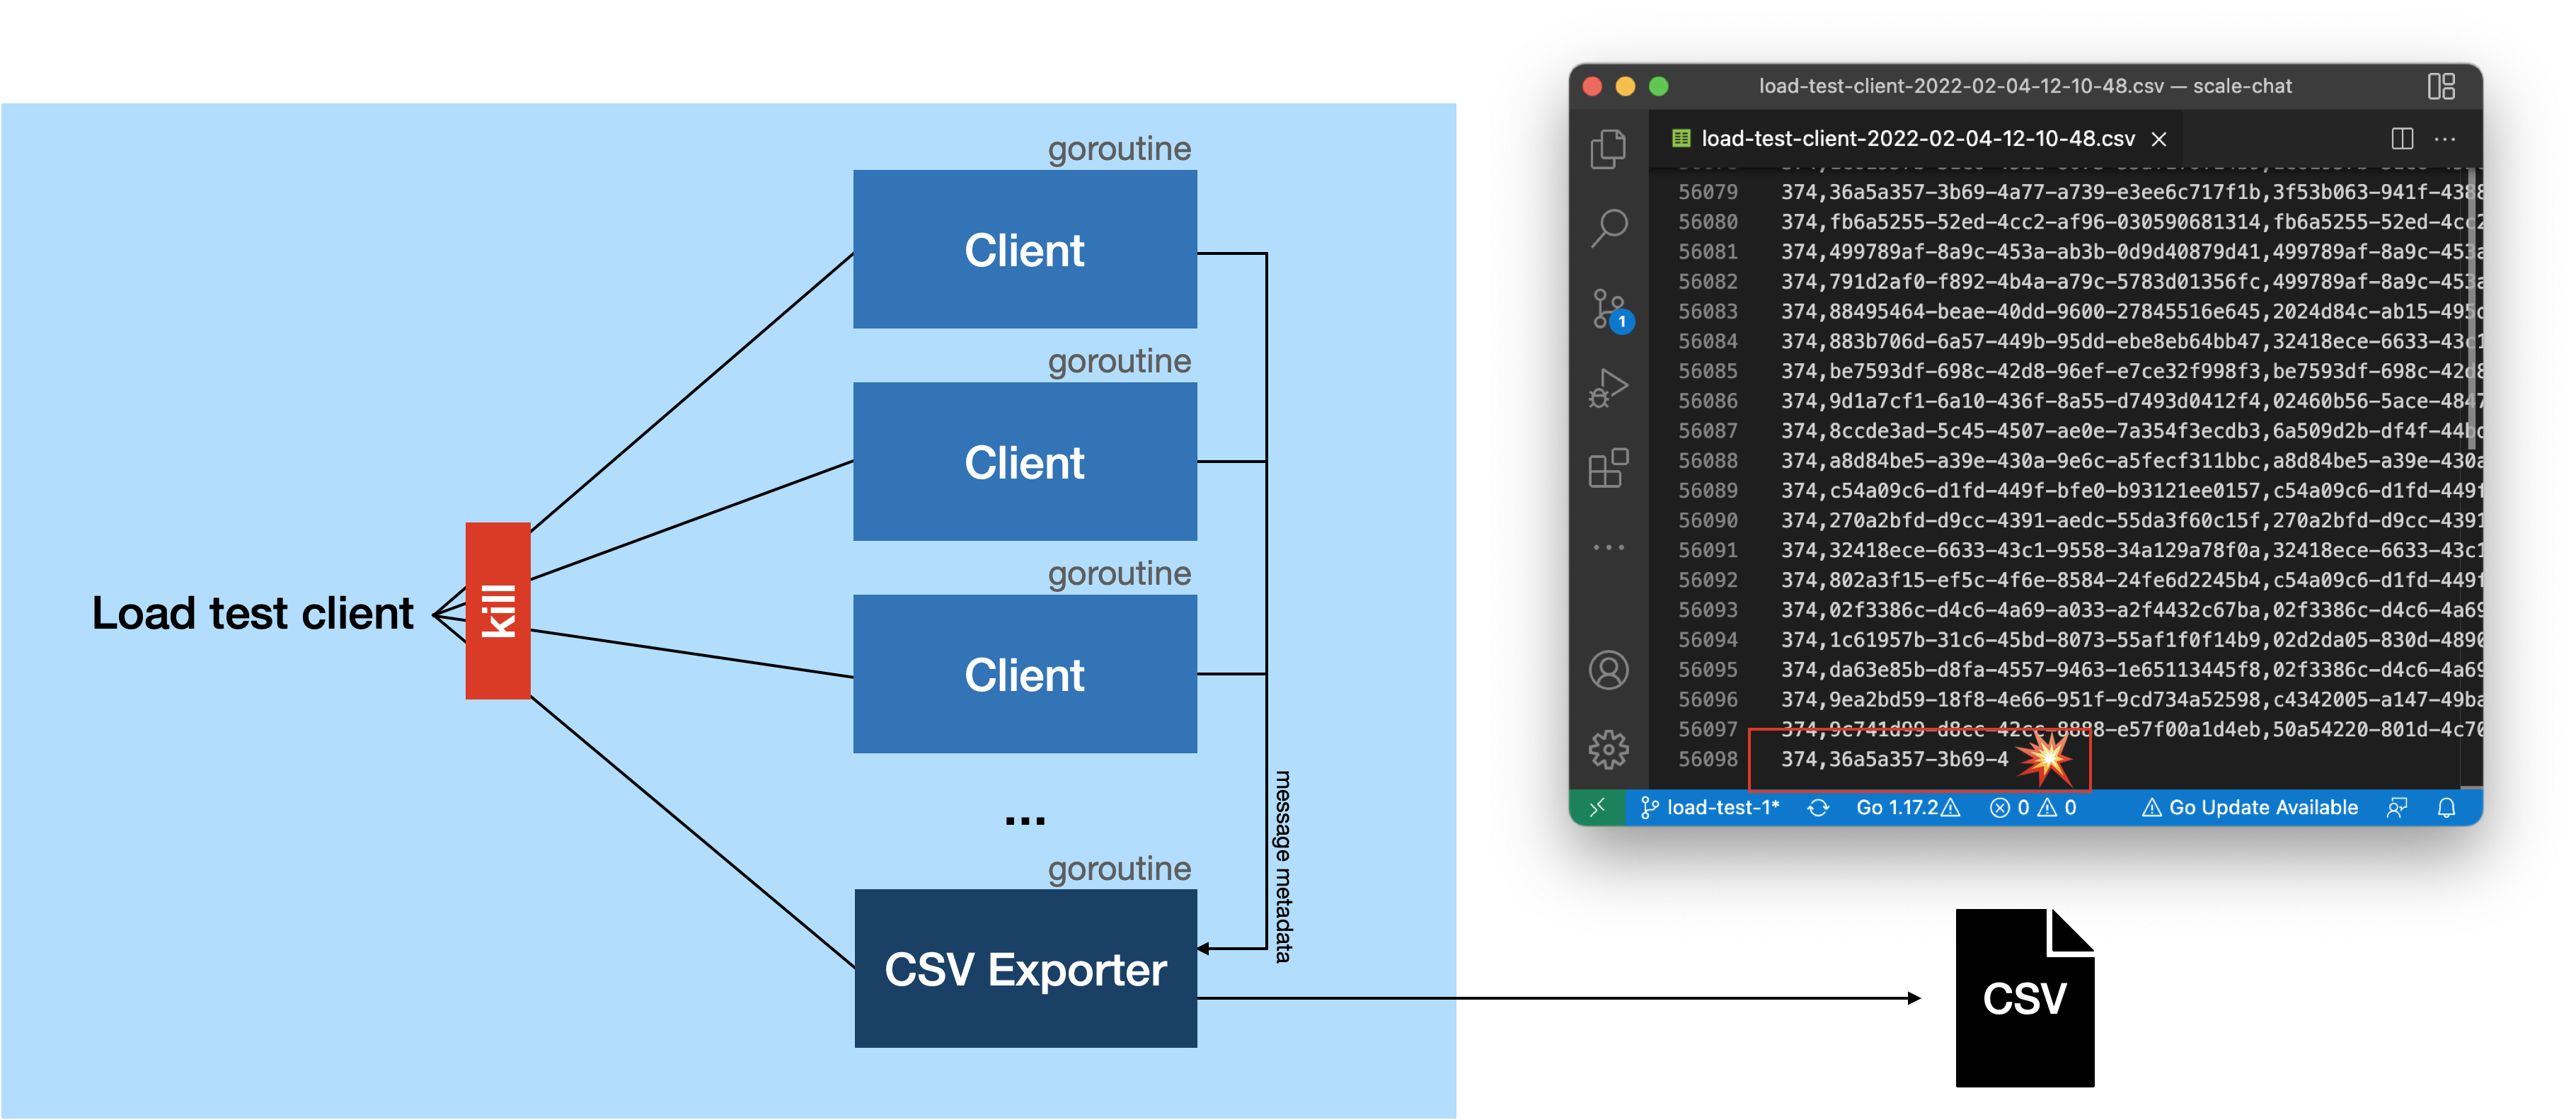
One of the errors appeared when we stopped the load test client. Most of the times we stopped it, the CSV file would contain incomplete lines. This was when we realized that the goroutines don’t shut down gracefully. They will be stopped regardless of the fact that they still perform some task. Additionally, the server showed a lot of error logs since the web socket connections of the clients weren’t closed gracefully.
Introducing WaitGroups
While investigating the errors, we realized that we didn’t stop the goroutines gracefully. We found several blog entries that used so-called "WaitGroups". A WaitGroup is basically a module that can be used to block until different tasks finish. Here is an example that shows how we used the WaitGroups to shut down the clients in the load test client in a controlled manner.
First of all you have to instantiate a WaitGroup. In the next step, you have to add the number of tasks that you will wait for. In our case, we want to create all clients for the chat. Therefore, the number of tasks we have to wait for equals the number of clients.
waitGroup := &sync.WaitGroup{}
waitGroup.Add(numOfClients)

var cancelFuncs []*context.CancelFunc
The cancel functions will be used to notify the clients that they have to shut down. For each client we create, a new cancel function will be added to the list. In order to notify the main Goroutine that a client task is completed, the WaitGroup instance has to be handed over as well – so the side routine can call "Done()" on the WaitGroup instance.
for i := 0; i < *numOfClents; i++ {
  ctx, cancelFunc := context.WithCancel(context.Background())
  cancelFuncs = append(cancelFuncs, &cancelFunc)

  go func() {
    chatClient := client.Client{
      Context:          ctx,
      WaitGroup:        waitGroup,
      ServerUrl:        *serverUrl,
      CloseConnection:  closeConnection,
      IsLoadTestClient: *loadTest,
      MsgFrequency:     *msgFrequency,
      MsgSize:          *msgSize,
      MsgEvents:        msgEvents,
      Room:             room,
    }

    err := chatClient.Start()
    if err != nil {
      log.Fatalf("%v", err)
    }
  }()
}
Now, the client has a cancel function and a WaitGroup, but how does this help us when shutting down the application? In order to understand this, let’s assume that the load test client application was cancelled by pressing "CTRL+C".
// Listen to system interrupts -> program will be stopped
sysInterrupt := make(chan os.Signal, 1)
signal.Notify(sysInterrupt, os.Interrupt)

<-sysInterrupt
log.Println("Shutting down clients...")

for _, cancelFunc := range cancelFuncs {
  (*cancelFunc)()
}
waitGroup.Wait()
As shown in the implementation above, the first step is to notify the clients
that they have to shut down. Therefore, the cancel functions that were stored in
the list will be executed. Afterwards, the waitGroup.Wait() blocks until all
clients completed their work. On the client side, the main Goroutine blocks until the cancel function is
executed:
// Waiting for shutdown...
<-client.Context.Done()
When this happens, the client can disconnect gracefully and shutdown the
Goroutines it started. When everything is done, the client executes waitGroup.Done(), signaling the task is completed. Afterwards, the Goroutine
will terminate.
After all clients were shut down, the waitGroup.Wait() will complete. In our
case, we still had to shut down the CSV write, which we implemented in the same
way. First, the writer will be informed that it should terminate by executing its
cancel function. When the whole data is written to the file, the writer will
execute the waitGroup.Done() method. The load test client blocks until this
timepoint and then terminates completely.
This way, we could on the one hand terminate the websocket connection gracefully so that the error log of the server is not flooded. On the other hand we could make sure that all incoming messages were logged and written to the CSV file.
Plotting Some Huge CSV Files
To analyze our first load test, we wanted to plot the results recorded by our load test client. In the first iteration, we took a graph rendering library for Go and parsed our huge CSV files that had a filesize upwards of 500MB per file. Since the library was designed to render graphs that are responsive and presented on the web, it was nearly impossible to get a browser to render the graphs we wanted with the amount of data points we had.
Since we knew that the landscape of plotting and data analysis tools in Python is enormously large, we started to parse our CSV files and render the resulting plots in Python using Pandas and Matplotlib. The rendering turned out much easier, especially because Matplotlib can render static images that can be embedded everywhere, including this blog and our presentation slides.
However, processing the CSV files to calculate the latency of every single message and aggregating this data took a long time. A really, really long time. In fact, it took so long to process the CSV files from a single load test that we re-implemented the CSV parsing, calculating the latencies, counting the messages and aggregating the results in Go, let it all run and the results were still available before Python was finished to parse a bunch of CSV files.

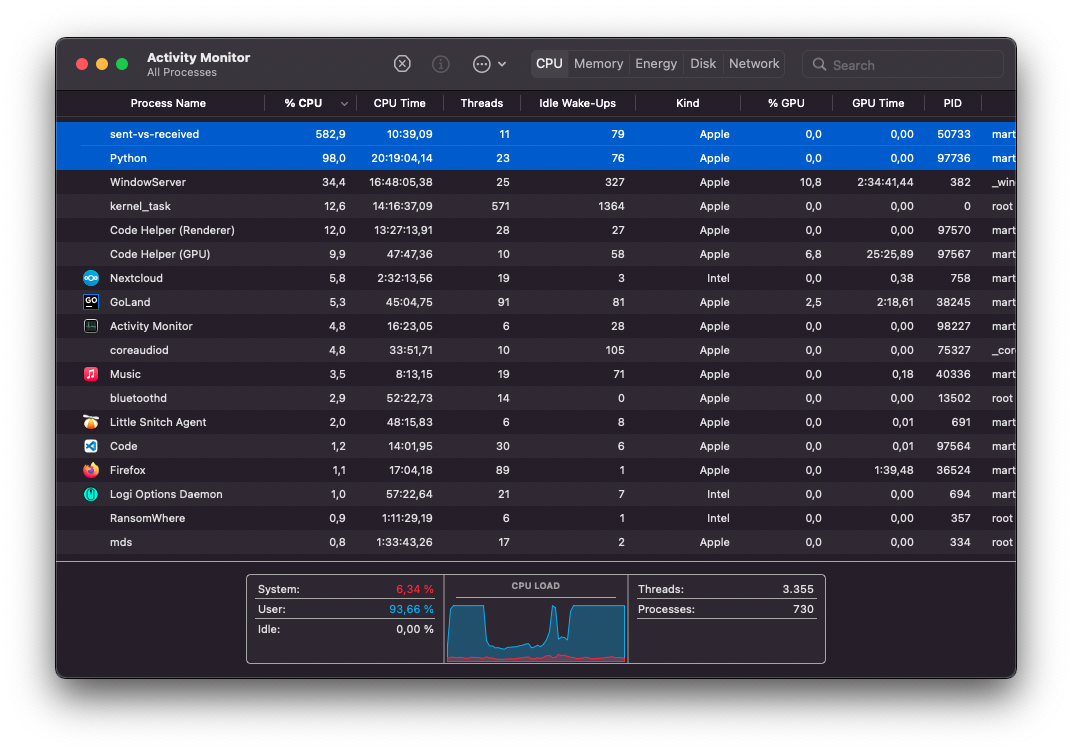
Our Go CSV processor massively made use of parallelism with Goroutines – which actually caused the fans in my notebook with an M1 Pro SoC to audibly spin for the first time since I bought it.
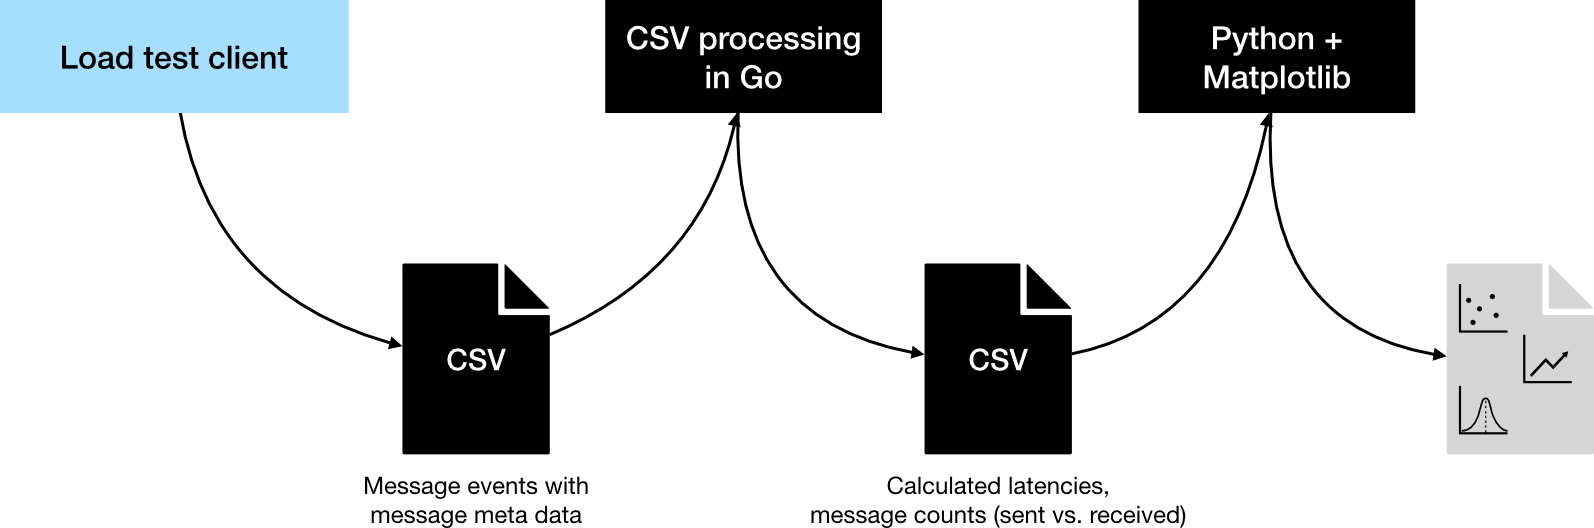
Our final rendering pipeline constisted of the load test client written in Go that would record a procotol of every load test in a large CSV file. The CSV processor, also written in Go, would then parse those large CSV files, calculate latencies and count messages. It would then aggregate the results and store it in a smaller CSV file. This file would then be parsed by a Python script to render the graphs you see in this blog post using Matplotlib.
Performing the First Load Test
For our first actual load test, we wanted to get a feeling for the magnitude we were playing with. We started very small – with 10 clients that would send and receive messages simultaneously. After that worked fine, we tried 20 clients. Then 30. 40. We went up like this until we reached the CPU limit we artificially restricted the container.
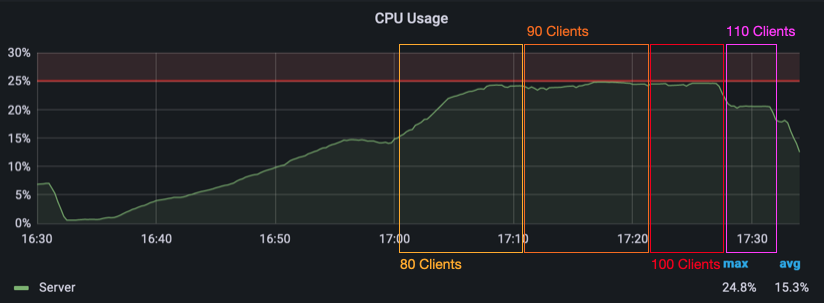
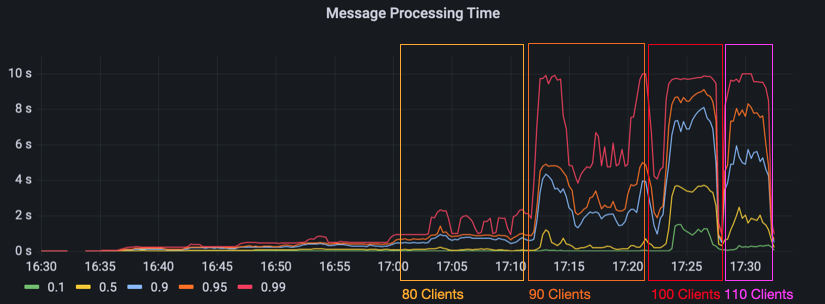
Starting at 90 clients, the message processing time jumps way up to about 10 seconds in the 99th percentile. The 95th and 90th percentile jitter around at about 3 and 2 seconds. With 100 clients, the 95th and 90th percentile go up to 9 and 7 seconds. Even the 10th percentile is now at over 1 second. The next two images show the message processing time and the CPU load for our first load test. You can see for yourself how the increasing amount of clients slowly melds away our server’s ability to handle every message in an acceptable timeframe.
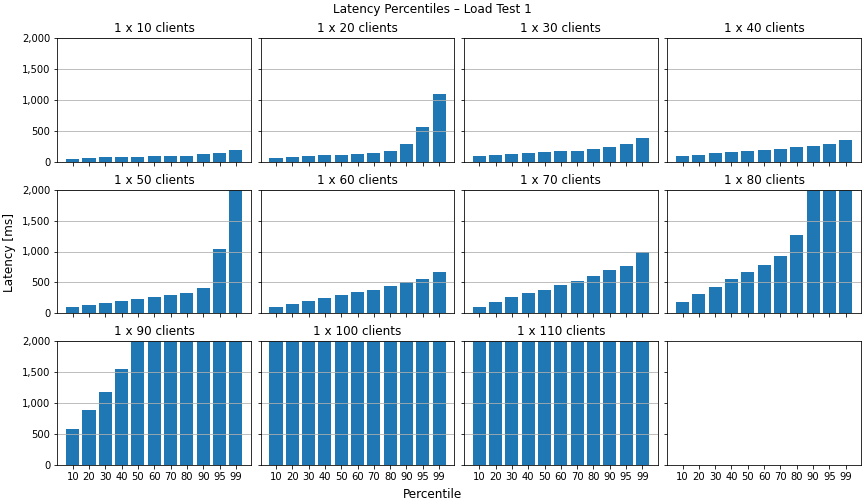
The next images show the evaluated results measured by the load test client. The first image shows the latency of a message. To measure the latency, the load test client records when it has sent a message and also when it receives it back. The latency is plotted by percentiles per load test configuration. Since everything above 2 seconds would be unusable in reality, we decided to truncate the graph at this limit. As you can see, the latency starts to noticably increase with 80 clients where the 90th percentile is over a second. With 90, 100 and 110 clients, the latencies in mostly all percentiles go up beyond the 2 seconds limit.
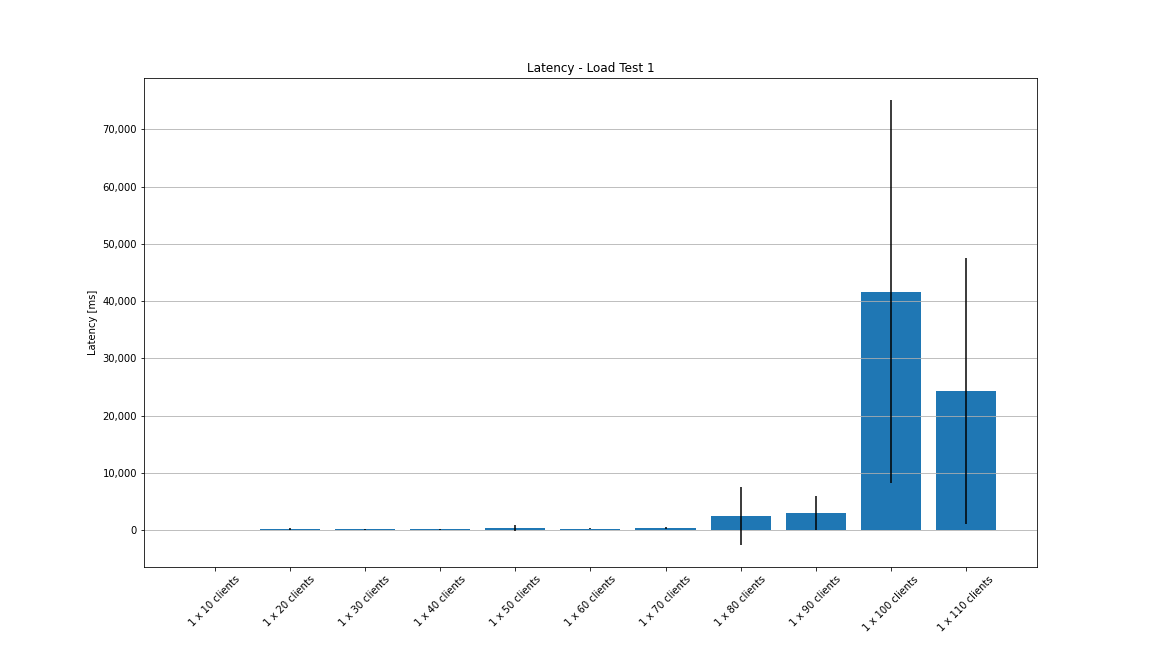
The next graph shows the mean latency of every configuration with the standard deviation. For 100 clients, the average latency is over 40 seconds!
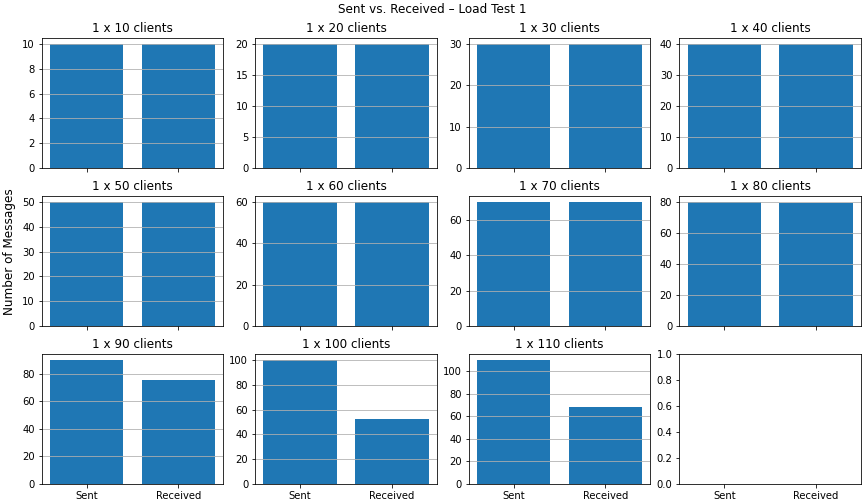
In the last graph, we can compare the number of sent messages to the number of received ones. This is useful to determine if the server delivers every message or if it skips some. As you can see, the number of received messages gets lower than the number of sent messages starting with 90 clients. With 100 clients, we only receive about half of the messages back within the load test. Note that the server would potentially deliver these "lost" messages after the load vanishes and it can catch up. However, for our test setup these late messages are not relevant.
Learnings From the First Load Test
The first load test gave us a baseline to work with – we found our first bottleneck. We realized that the jitter in the live monitoring makes it quite difficult to recognize new plateaus. We also saw that the message processing rate increases sharply when a bottleneck is in reach. From the last graph above, we saw that the server does not deliver every message back to the client under heavy load – at least while still under load. One other thing that we took away was that the preparations for an actual load test took way longer than we had anticipated.
Improving the Server
The next step was to implement the changes we decided on to improve the server. Since we decided to change the business concept of one global chat to several chat rooms, we first had to create a concept. There were basically two main ideas:
- Implement a handshake between the server and the client that includes adding the client to a specific chat room.
- Including the chat ID in the URL, insprired by Jitsi.
The first one would result in a huge refactoring and additional implementation efforts. Furthermore, we might be able to balance the load later on – based on the room id that would be included in the URL in with the second approach. Due to these reasons, we decided to use the URL approach.
(Docker) Networking at Its Finest
VPN
After implementing the necessary changes, we deployed the updated server and tried to run our second load test. The first test with two and four rooms with 25 clients each worked totally fine. When we tried to run more than 150 clients, we ran into a problem, though… Each time we started the 151th client, the load test client application crashed. WHAT THE HACK?!
In order to access and manage the server running at the university, we had to be logged into a VPN. The SSH port of our VM is not accessible from the outside world. While investigating the error, we also tested starting the clients on a local machine that was not connected to the VPN. The clients started flawlessly and more than 150 connections were no problem. Since we used port 8080 on the server, traffic needed to go through the VPN to reach it, though.
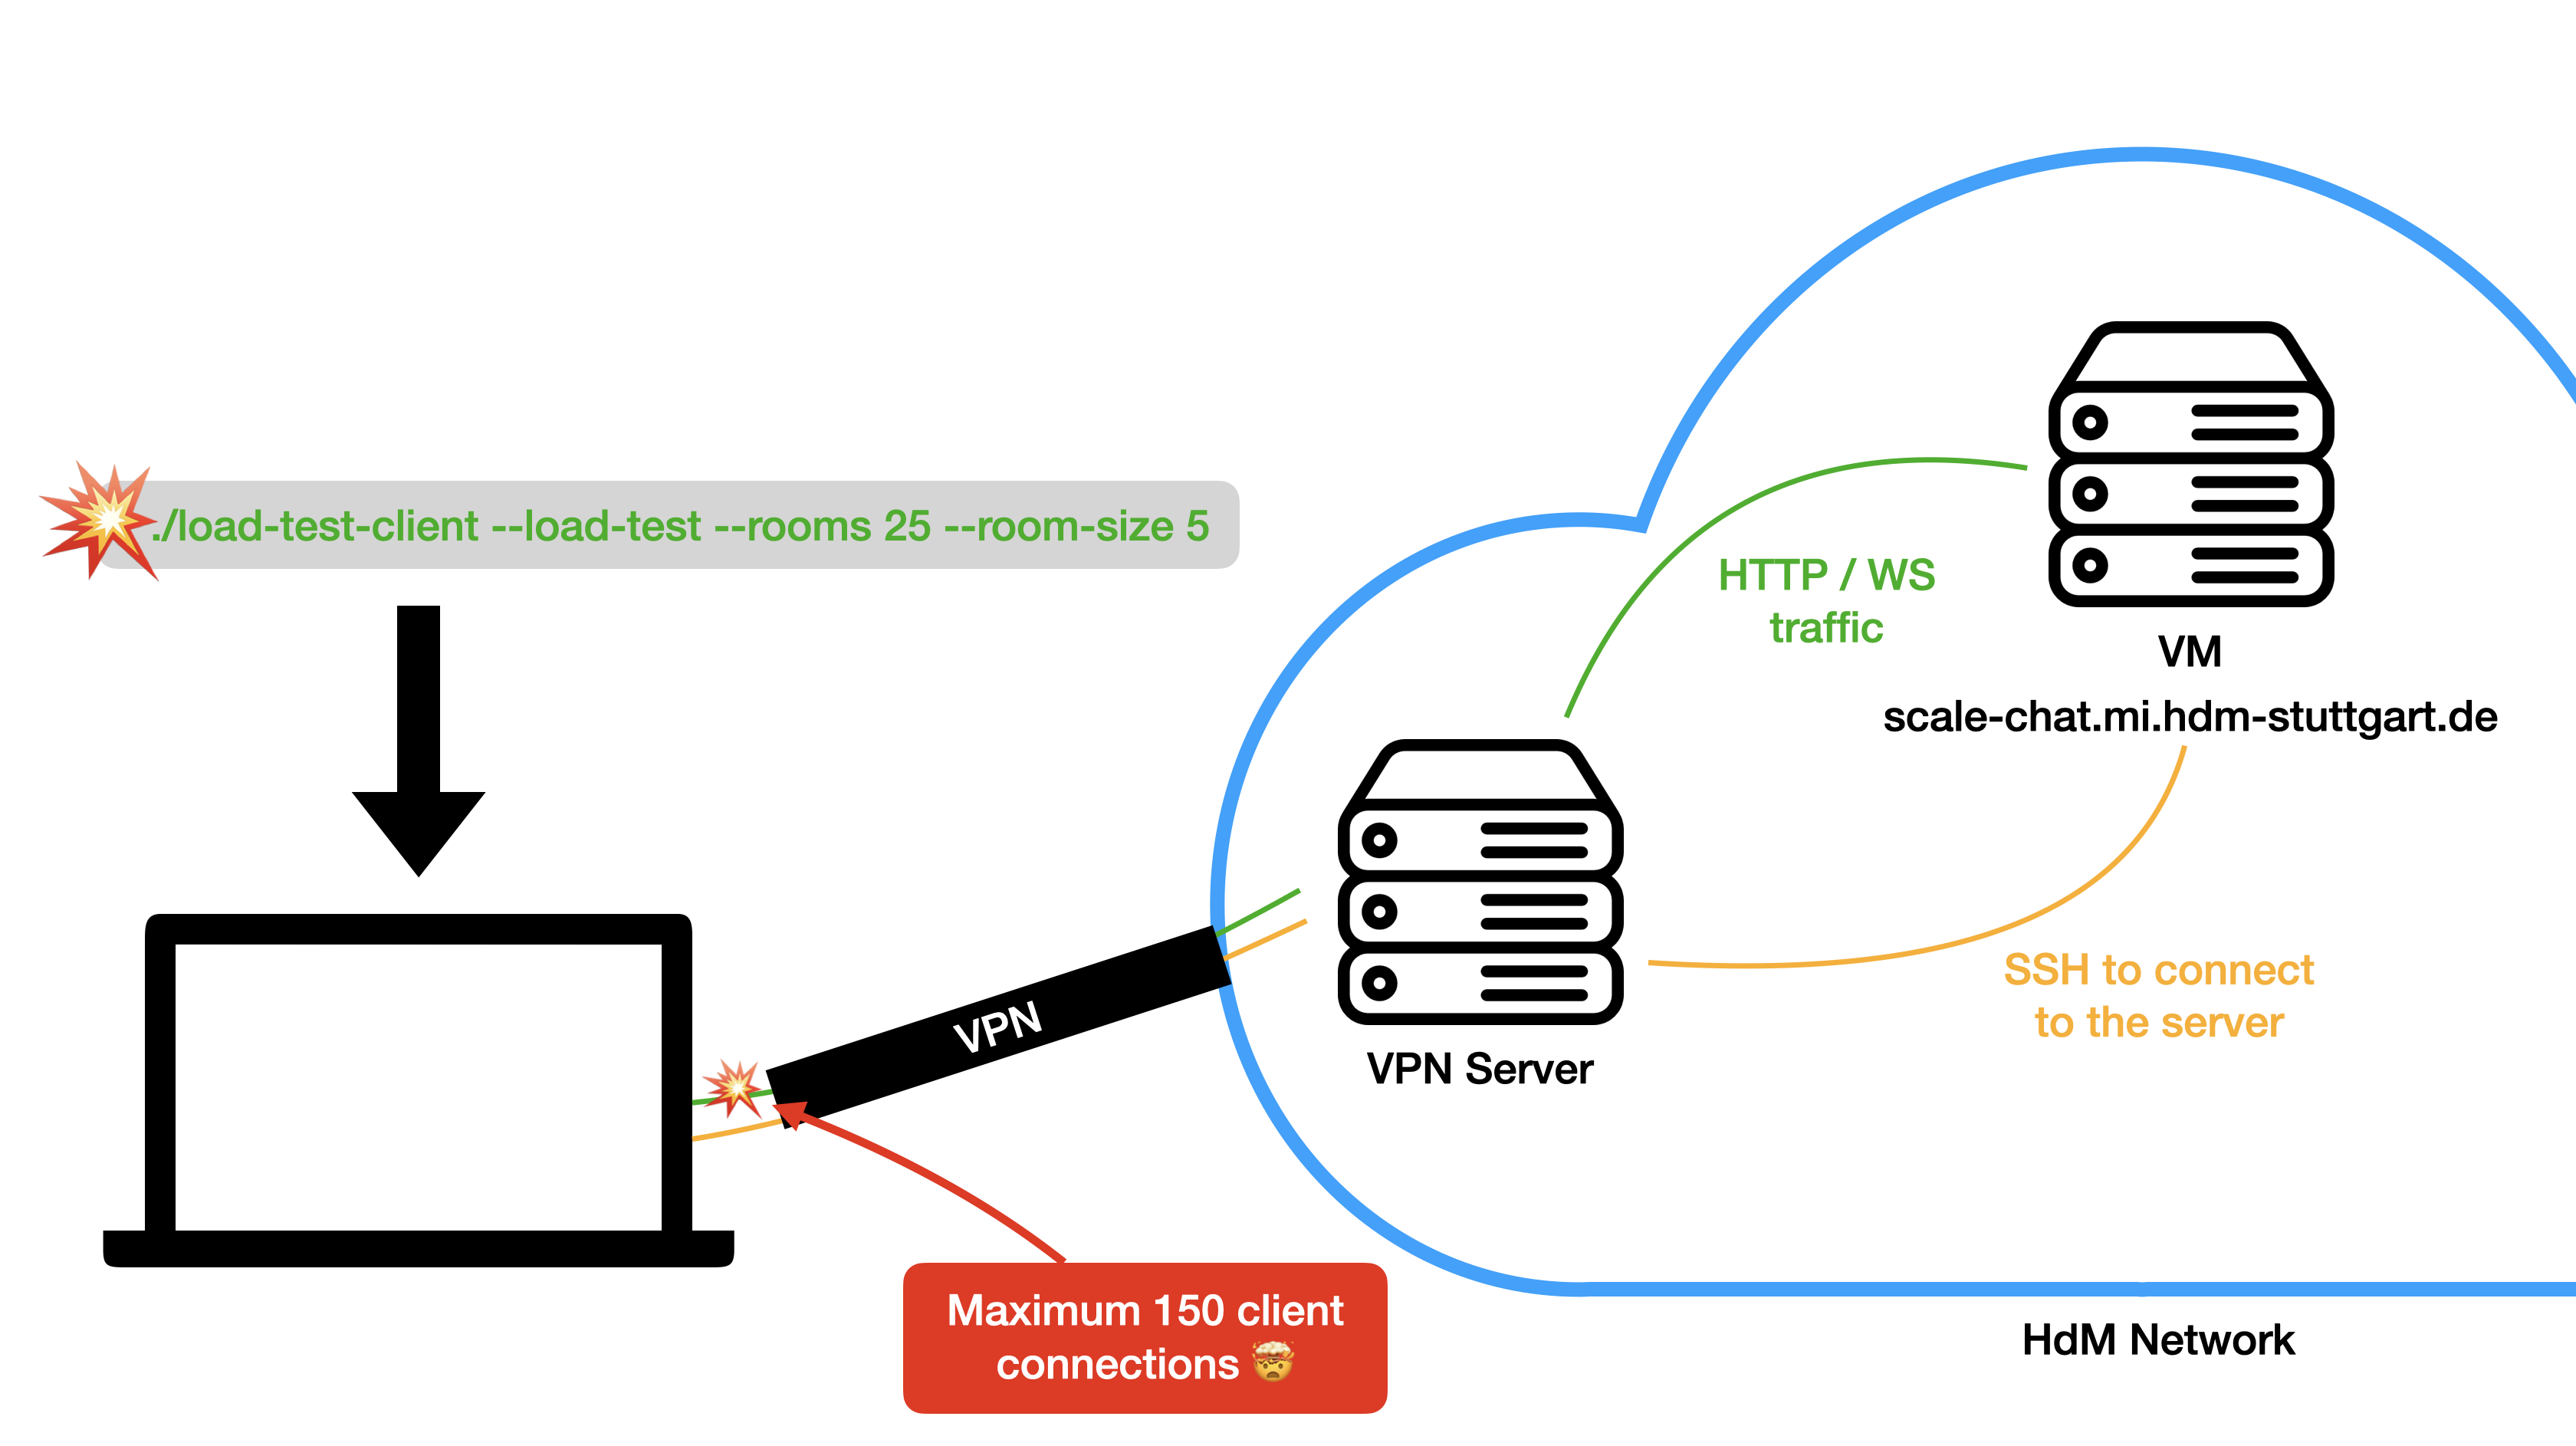
The thing is that we needed the VPN to access the Grafana dashboard. The firewall didn’t allow outside traffic to other ports than 80 and 443. Thus, we had to change the server configuration to run on port 80 so that a load test client would be able to connect to it without traffic running through the VPN. Since we also needed to keep an eye on our Grafana dashboard, we forwarded port 3000 through an SSH connection.
ssh -L 3000:localhost:3000 root@scale-chat.mi.hdm-stuttgart.de
Docker DNS
Being fully motivated after finding the issue, we wanted to finally run the second load test. Since we weren’t sure if the server’s container was the latest version, we started a rebuild of the container. This was the moment we smashed to the ground the second time that day.
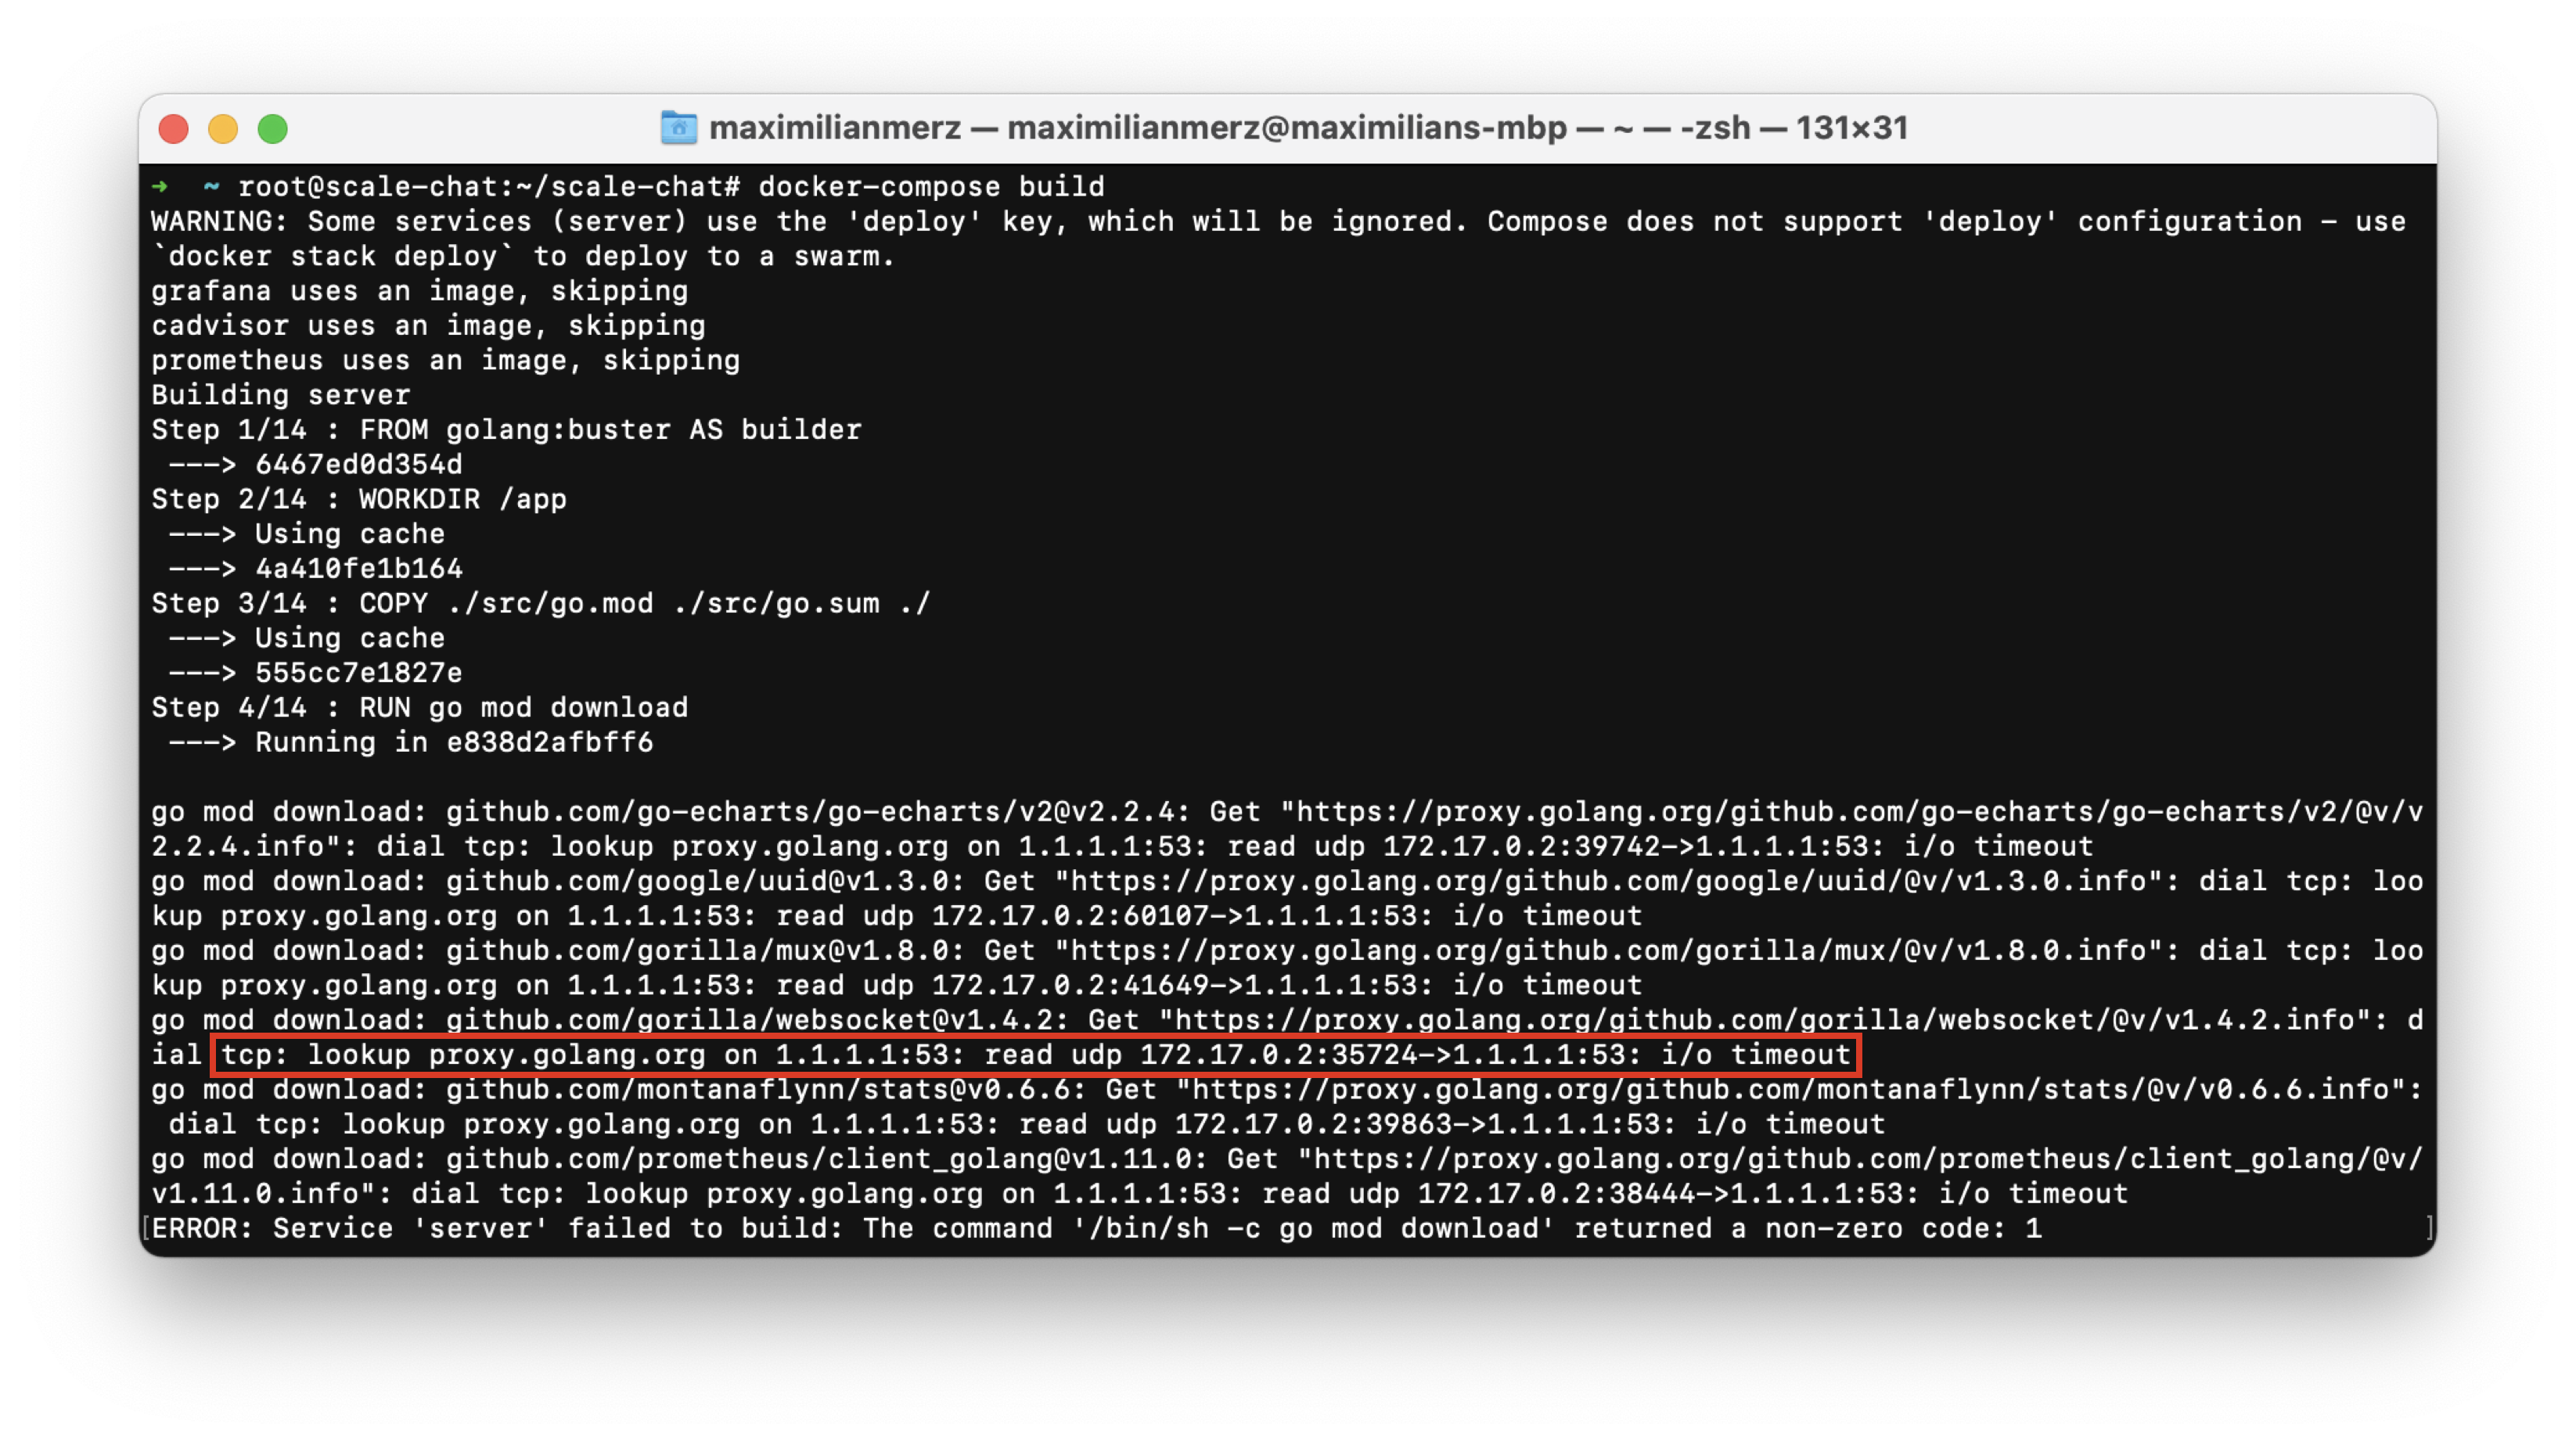
For some reason the dependencies could’t be downloaded anymore… Again: WHAT THE HACK?!
We tried everything that we could think of to solve the problem. We changed the
host server’s DNS resolver, modified the Docker host configuration, playing
around with firewall rules. Of course, we rebooted the machine a few times as
well – but nothing would help. After investing the problem and researching for
quite some time, we found a hint that this error might occur due to a hung up docker0 network bridge. After resetting all Docker networking on the machine,
the problem was indeed gone and we could finally start to run our second load
test.
Performing the Second Load Test
For the second load test, we wanted to try a few different combinations of clients per room and room count. We began with 25 rooms and 2 clients per room. We then increased the number of clients per room until we hit our CPU limit again. When we hit the limit, we had 16 clients in 25 rooms – making for 400 total clients served.
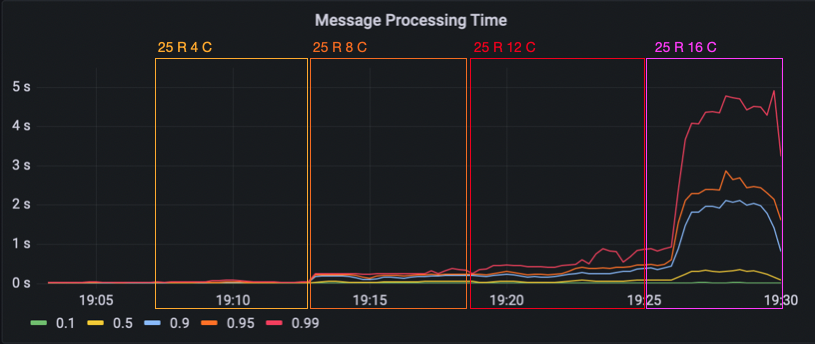

Since we hit the limit with 16 clients per room, next we lowered the room size down to 8 clients per room and tried 50 rooms. Then, 12 clients per room with 50 rooms. We went back down to 8 clients per room and instead increased the amount of rooms to 75. Now, we had hit a limit again.
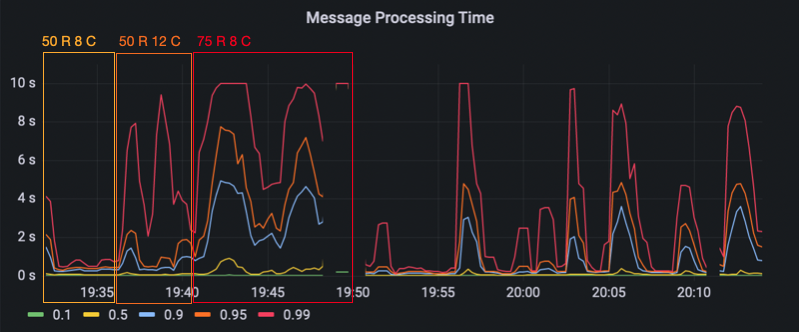
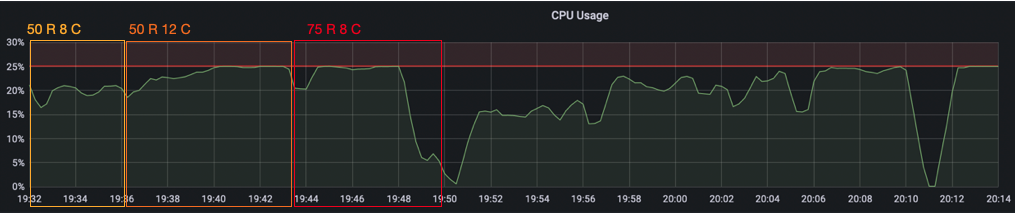
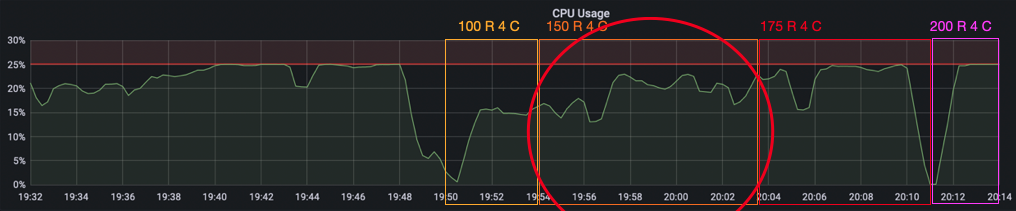
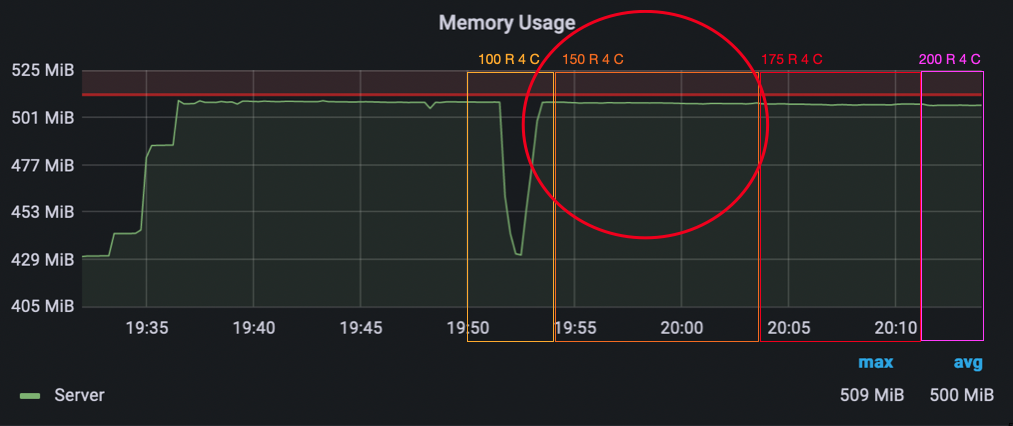
Finally, we wanted to see how far we can scale the room count and went back down to 4 clients per room. We began with 100 rooms. Then 150, where we saw a massive increase in the message processing time in the 99th percentile (up to 10 seconds again). When looking at the CPU usage though, we did not hit the limit yet. However, we instead now hit a memory limit because our chat server keeps a chat history that filled up the available memory. We continued to test with 175 and 200 rooms, until we hit the CPU limit as well and decided that it was enough.

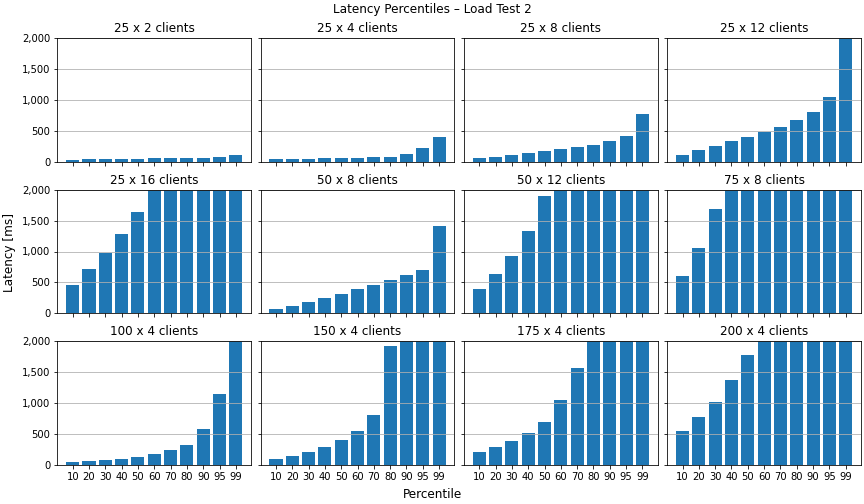
Now, let’s have a look at the visualized load test results. The latency percentile graph confirms what we saw earlier in the Grafana dashboard. The configurations where we hit the bottlenecks show latencies go up over 2 seconds for everything upwards of the 60th percentile.
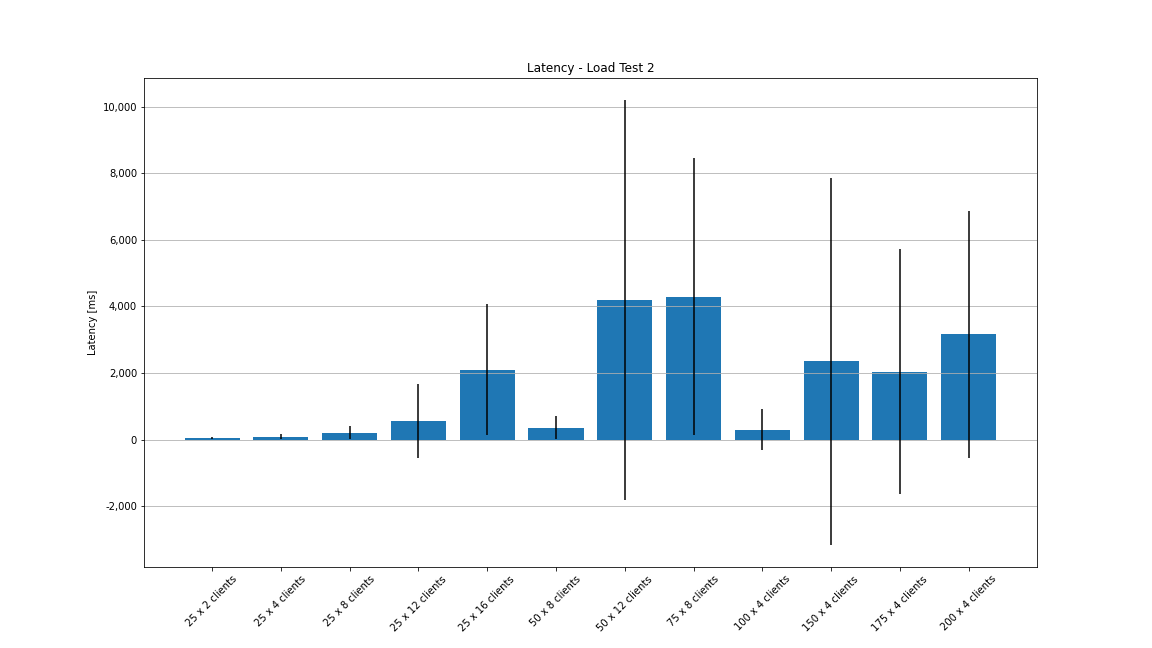
The average latency graph looks very strange for this test. The mean latency never goes way beyond 4 seconds, but the standard deviation is extremely huge (partly ± 26 seconds).
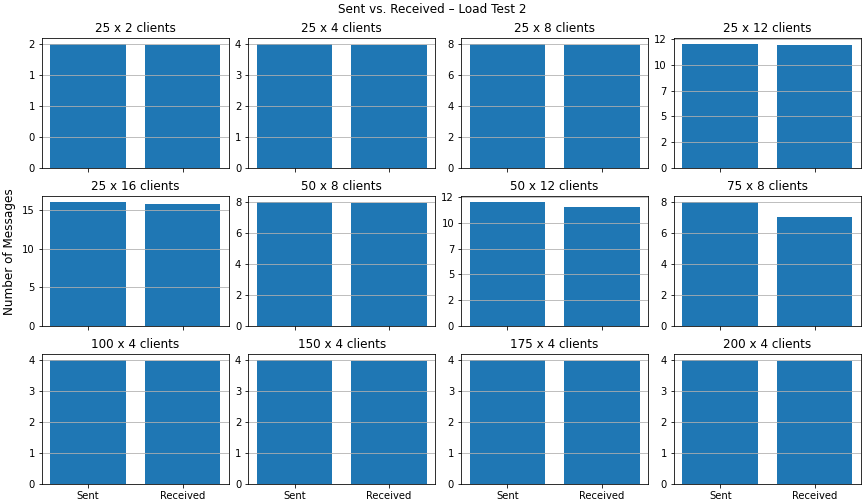
For the second load test, we see that no messages are getting lost when comparing the counts of sent vs. received messages – except for the configuration with 75 rooms with 8 clients each.
Learnings From the Second Load Test
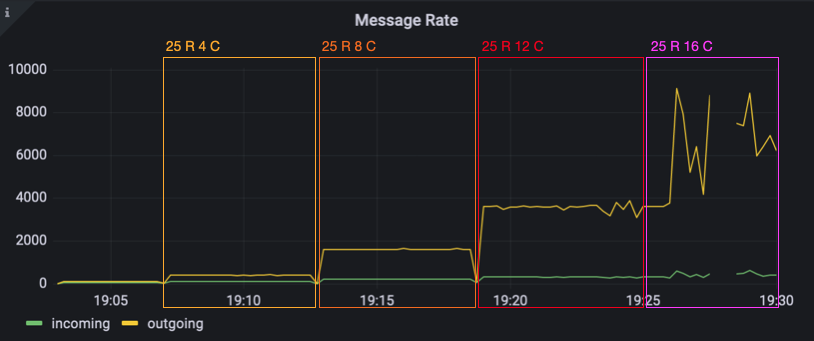
In the second load test, we saw that splitting clients into multiple chat rooms reduces server load dramatically – without even scaling the server itself. With mor smaller chat rooms, more total clients can be served. We also saw that the message processing time in the 90th, 95th and 99th percentile was >2 seconds long before the CPU limit was reached. We identified memory as another bottleneck with 150 rooms and 4 clients per room. Of course, we provoked the server to run in a memory bottleneck by storing the message history in an array. The idea here was to see when this implementation error becomes noticeable. Later in the analysis, we noticed that our Prometheus data had a gap in the message rate for 25 rooms and 16 clients per room. At the time of the gap, the CPU usage of the server container reaches the CPU limit. We think the data gap might be caused by the huge load which prevents the server from responding to Prometheus’ scrape requests on its interal monitoring port.
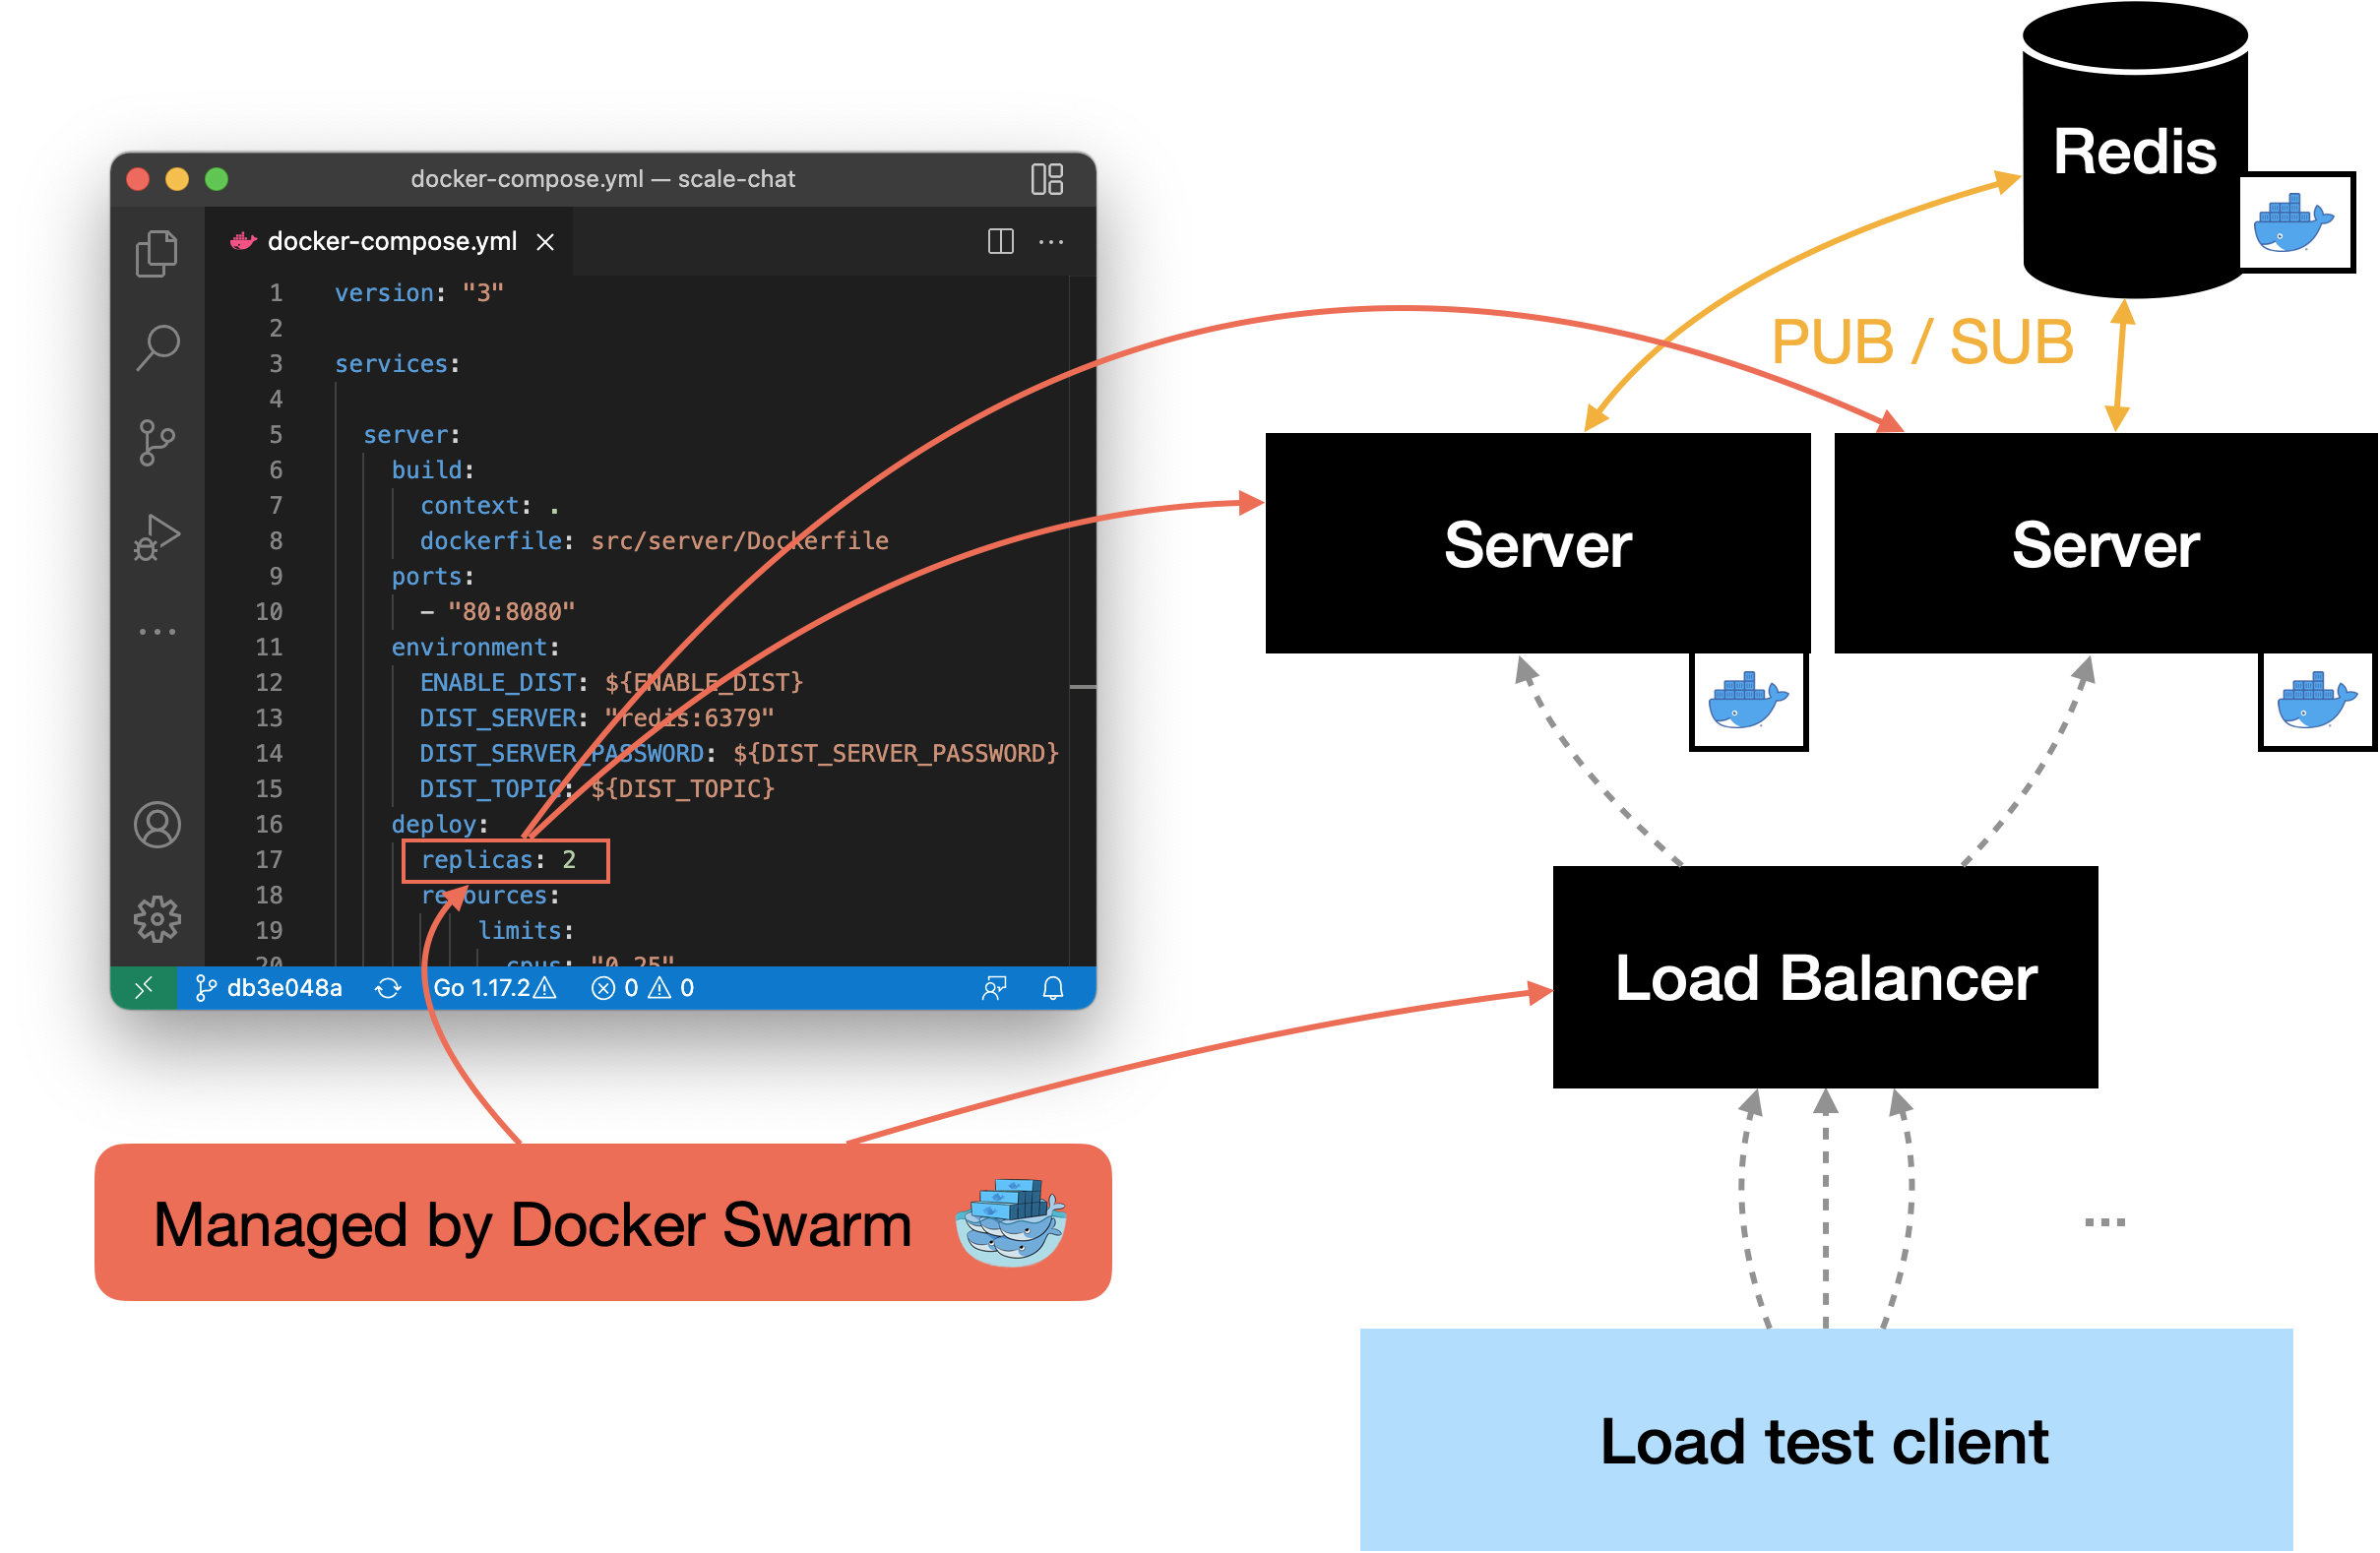
Scaling the Server
The next task was to scale the server horizontally. Scaling the actual container to two replicas was the easiest task, since Docker Swarm can create replicas by its own. The next thing was to split the load between the two server instances. In addition to creating the replicas, Docker Swarm deploys a load balancer that loadbalances all requests to the containers using round robin.
Since we had the idea to loadbalance the clients based on their chat room that is included in the URL, we thought about changing the loadbalancer. One of the problems we had was that a lot of proxies did’t support the possibility of sticking a specific URI to one server instance. Therefore, we couldn’t find examples of previous proxy configurations that helped us. The only thing was the HAProxy configuration of a horizontally-scaled Jitsi deployment – but when we tried to adapt their configuration to our setup, we failed as well.
In the end, we decided to use the load balancer that is included in Docker Swarm, even if it would loadbalance the traffic round robin. Since the requests now will be loadbalanced round robin, clients in the same chat room might connect to different servers. With the current implementation, this would result in two clients that would’t receive messages from each other. In order to make this possible, the two server instances had to exchange all messages they receive with each other.
To solve the problem, we added a component to the server that we named Distributor. Its task is to send all messages received from clients to the
other server instances. Additionally, the Distributor is capable of receiving
messages that were sent by the other server’s Distributors. To exchange
messages between the server instances, we use the publish & subscribe functionality
provided by Redis. Both of us have been working with Redis as a key-value store
before. Therefore, we wanted to try out this additional feature.
The Moment We Broke Up With Docker Swarm
At this stage, we thought that we solved all problems and that we are now capable of scaling the server for additional load. Therefore, we started another load test. First, everything went fine – but after some minutes we realized that the values we saw in the monitoring dashboard did’t make sense. The number of incoming and outgoing messages didn’t meet our expectations. The values matched the expectations for one server instance but not two…
After taking a closer look at how Prometheus scrapes the servers and with an eye on the Docker Swarm deployment, we realized that Prometheus ist just requesting one server. More specific, it requested the metrics alternately from the two server instances – because the requests were load balanced round robin through the Docker Swarm load balancer as well…
While researching for a solution, we found out that Prometheus is capable of discovering targets in a Docker Swarm. This would have the advantage that we can scale the server and the monitoring would adapt automatically without the need for further configuration. The only problem was that we didn’t manage to get the auto discovery to work…
What now? After some discussions and the fact that the project had to come to an end, we decided to go the dirty path. This included setting up a second server instace manually and adding the second instance’s DNS name to the Prometheus scraping list. Since we couldn’t use the Docker Swarm load balancer anymore, we had to deploy one by ourselves. Here we decided to use Traefik since we have made some experience with it in the past – and we liked the possibility to configure it with Docker labels.
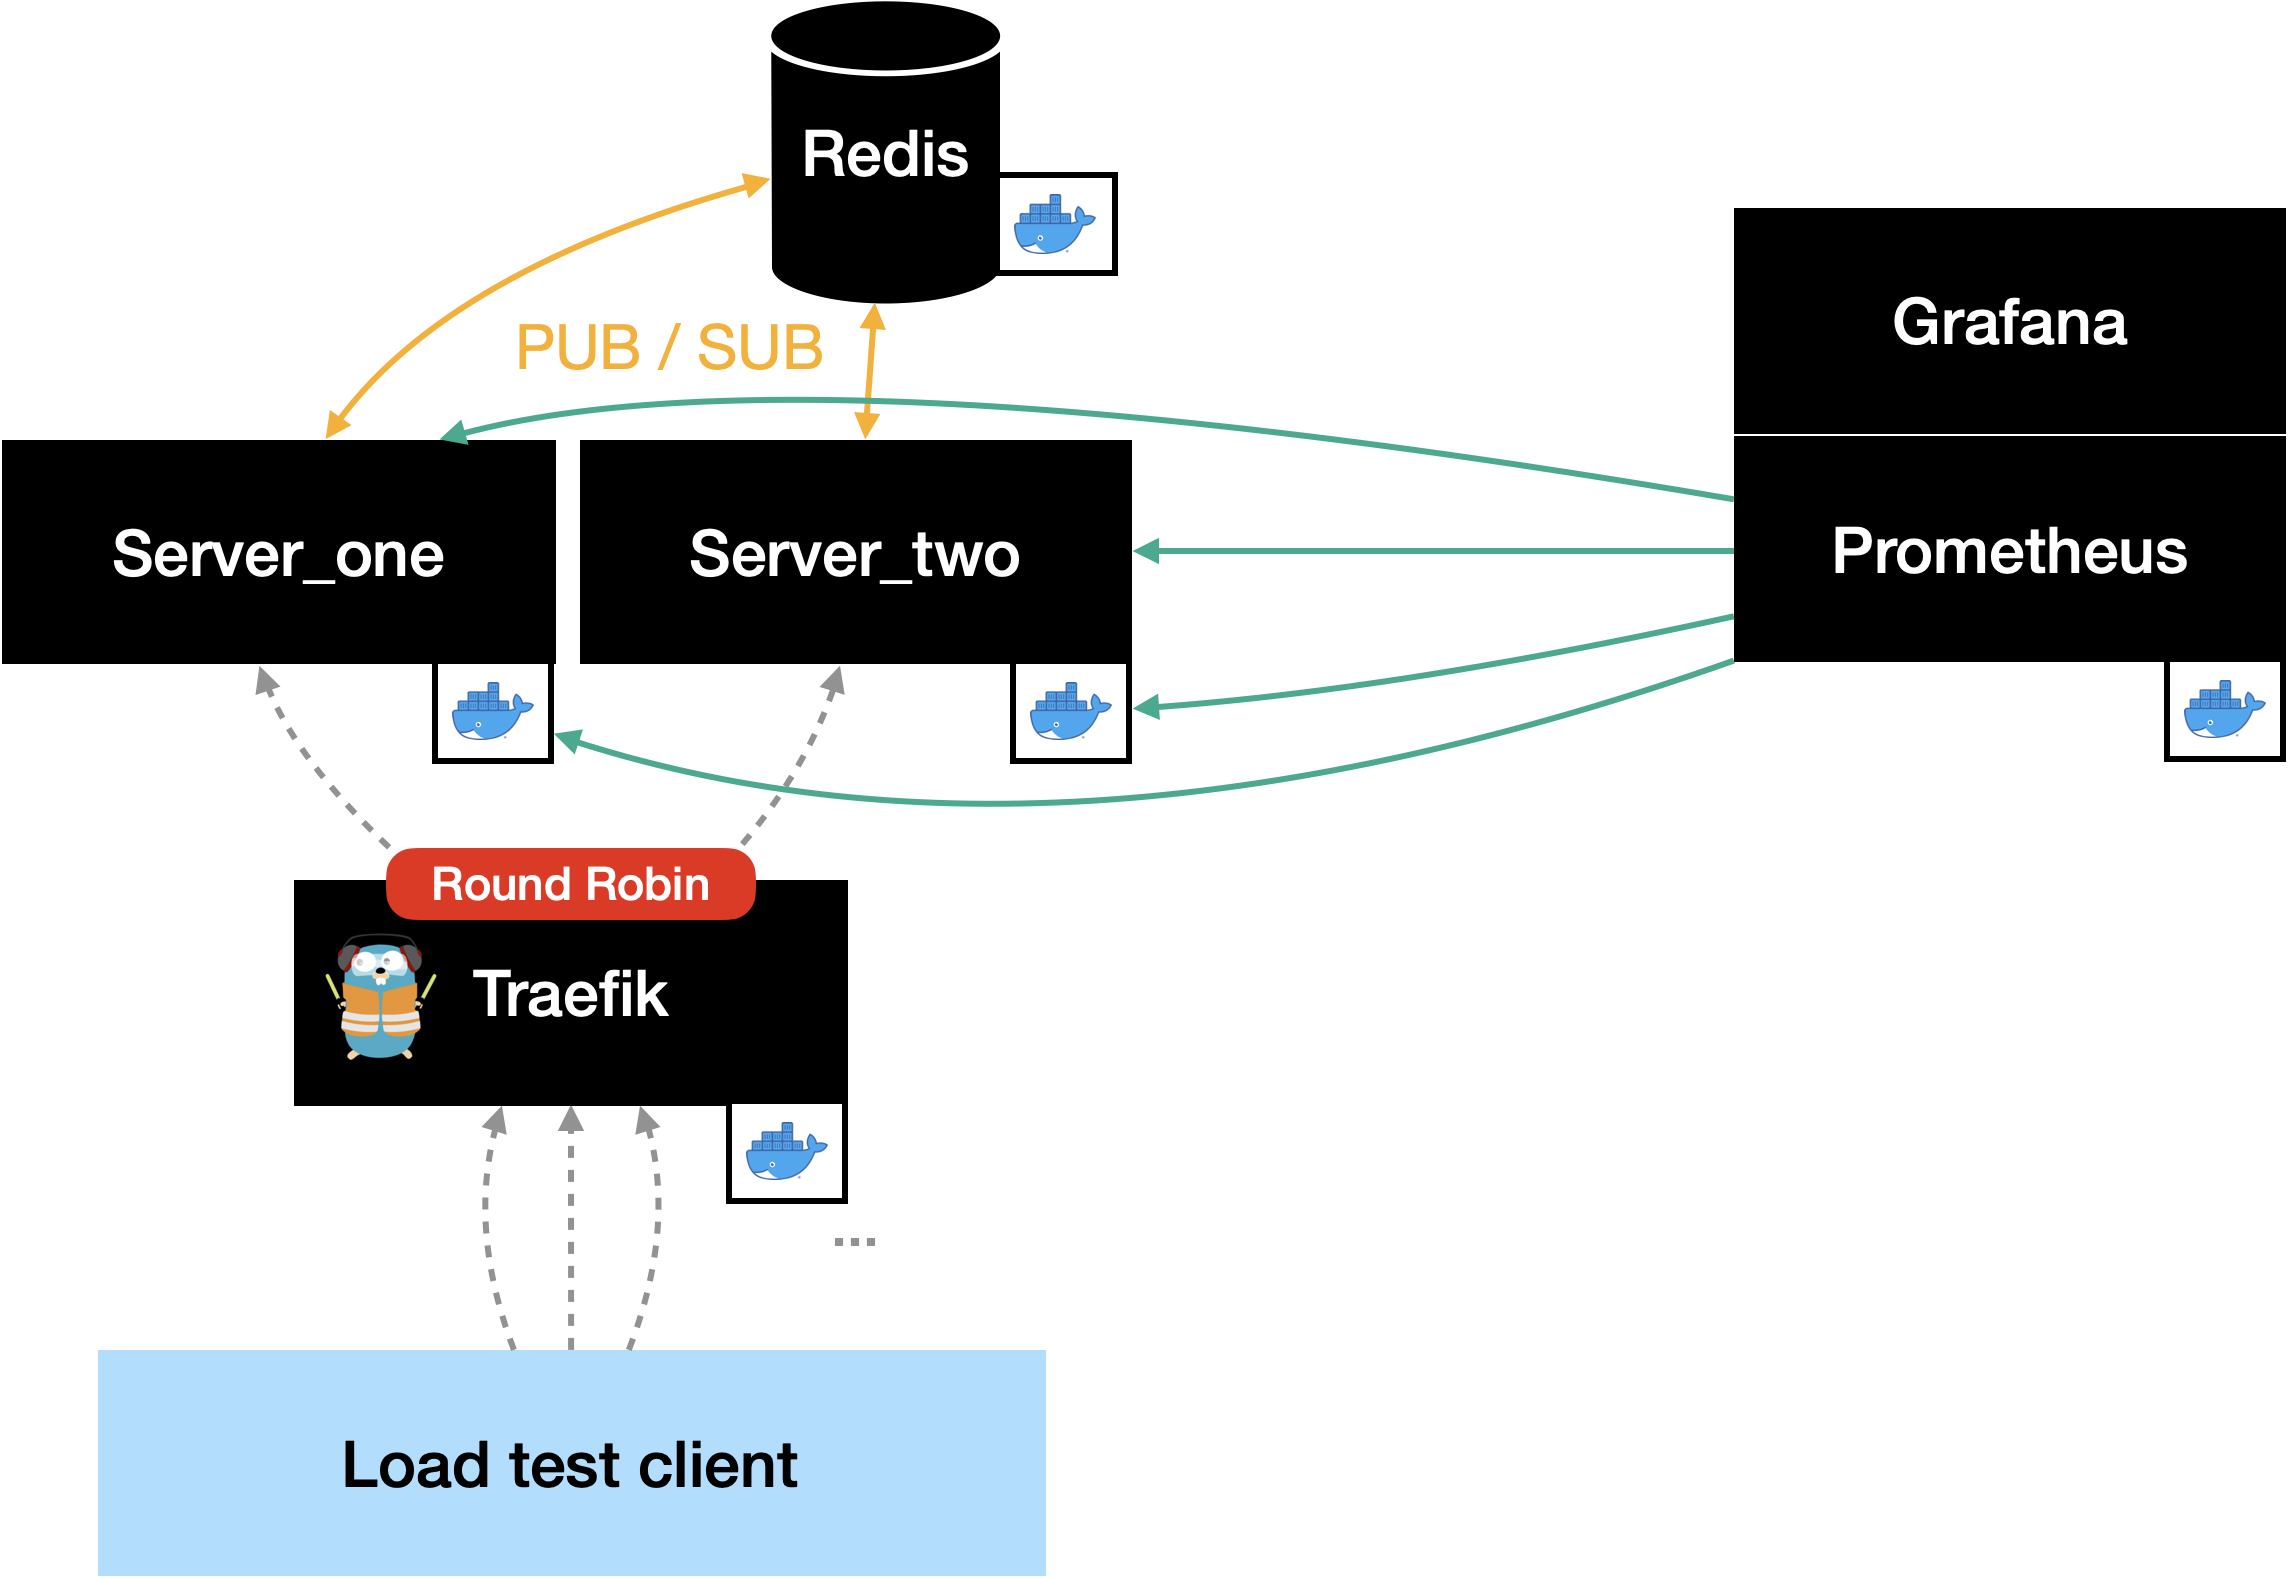
We know that this solution is not the nicest, but since we really wanted to run a load test with both server instances, this was the fastest option for us.
The Third Load Test
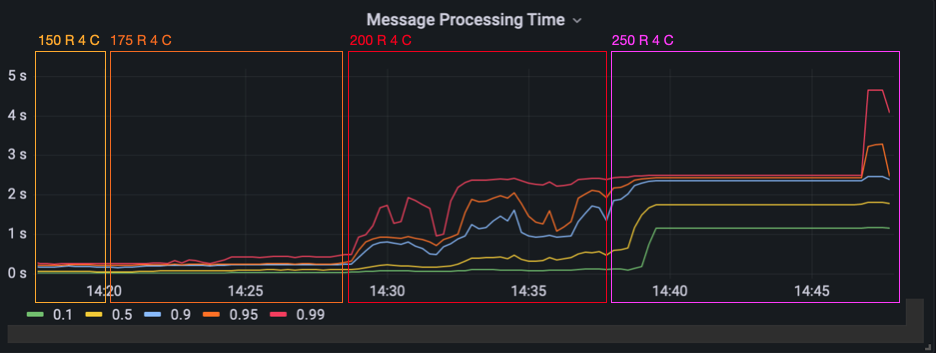
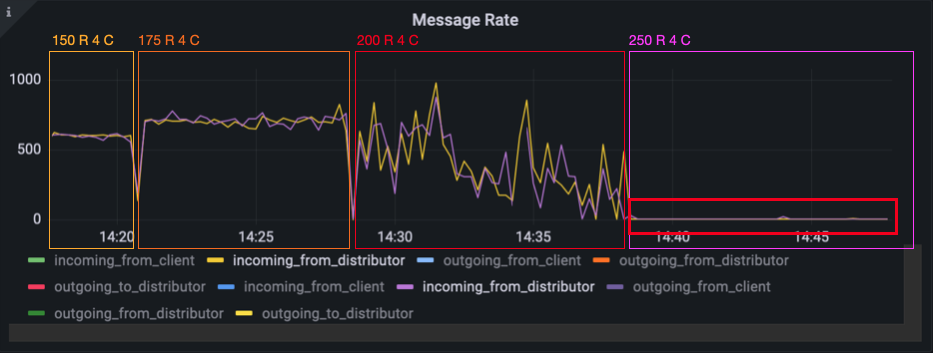
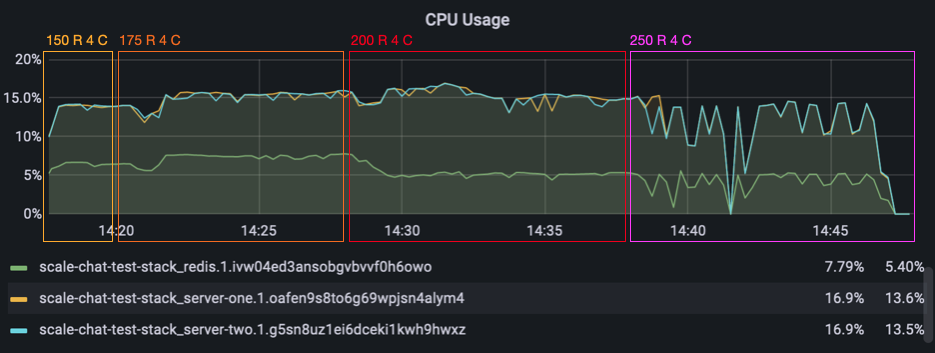
Now that we finally had a working deployment with two server instances, we were excited to run the third load test. Like in the last round of the last test, we used 4 clients per room and started with 150 rooms. We scaled the number of rooms up to 175 without a problem. As you can see in the Grafana graph below, the message processing time increased and got more jitter with 200 rooms. With 250 rooms, it increases in the 10th and 50th percentile, but stays on the same level for the 99th percentile. What’s weird is that the graph gets extremely flat – the jitter is completely gone.
When we had a look at the message rate, we saw a similar effect. The rates for 200 rooms bounce around so that it almost looks like a chalk painting done by a small child. With 250 rooms, the jitter is almost gone.
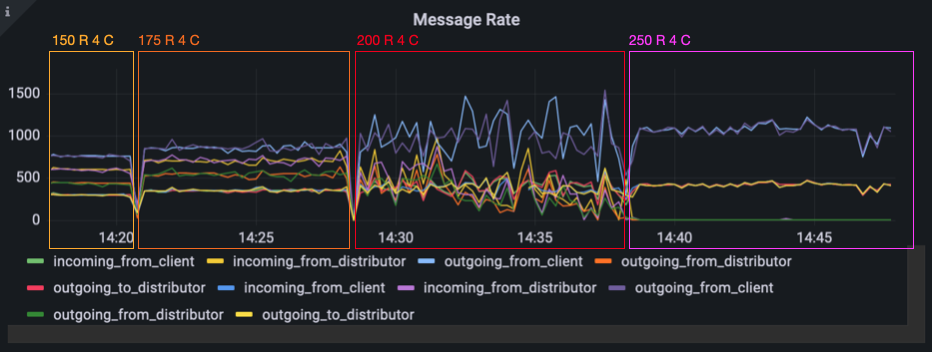
When we filtered for messages that were coming from our Redis message subscription, we saw almost nothing. The incoming message rate from Redis was at about 1.4 messages per 10 seconds. After we both were quite suprised by this behavior, we suspected that our Redis container might be working at full capacity.
But when looking at the CPU usage of the redis container and both server containers, everything was fine. They all were below 15%.
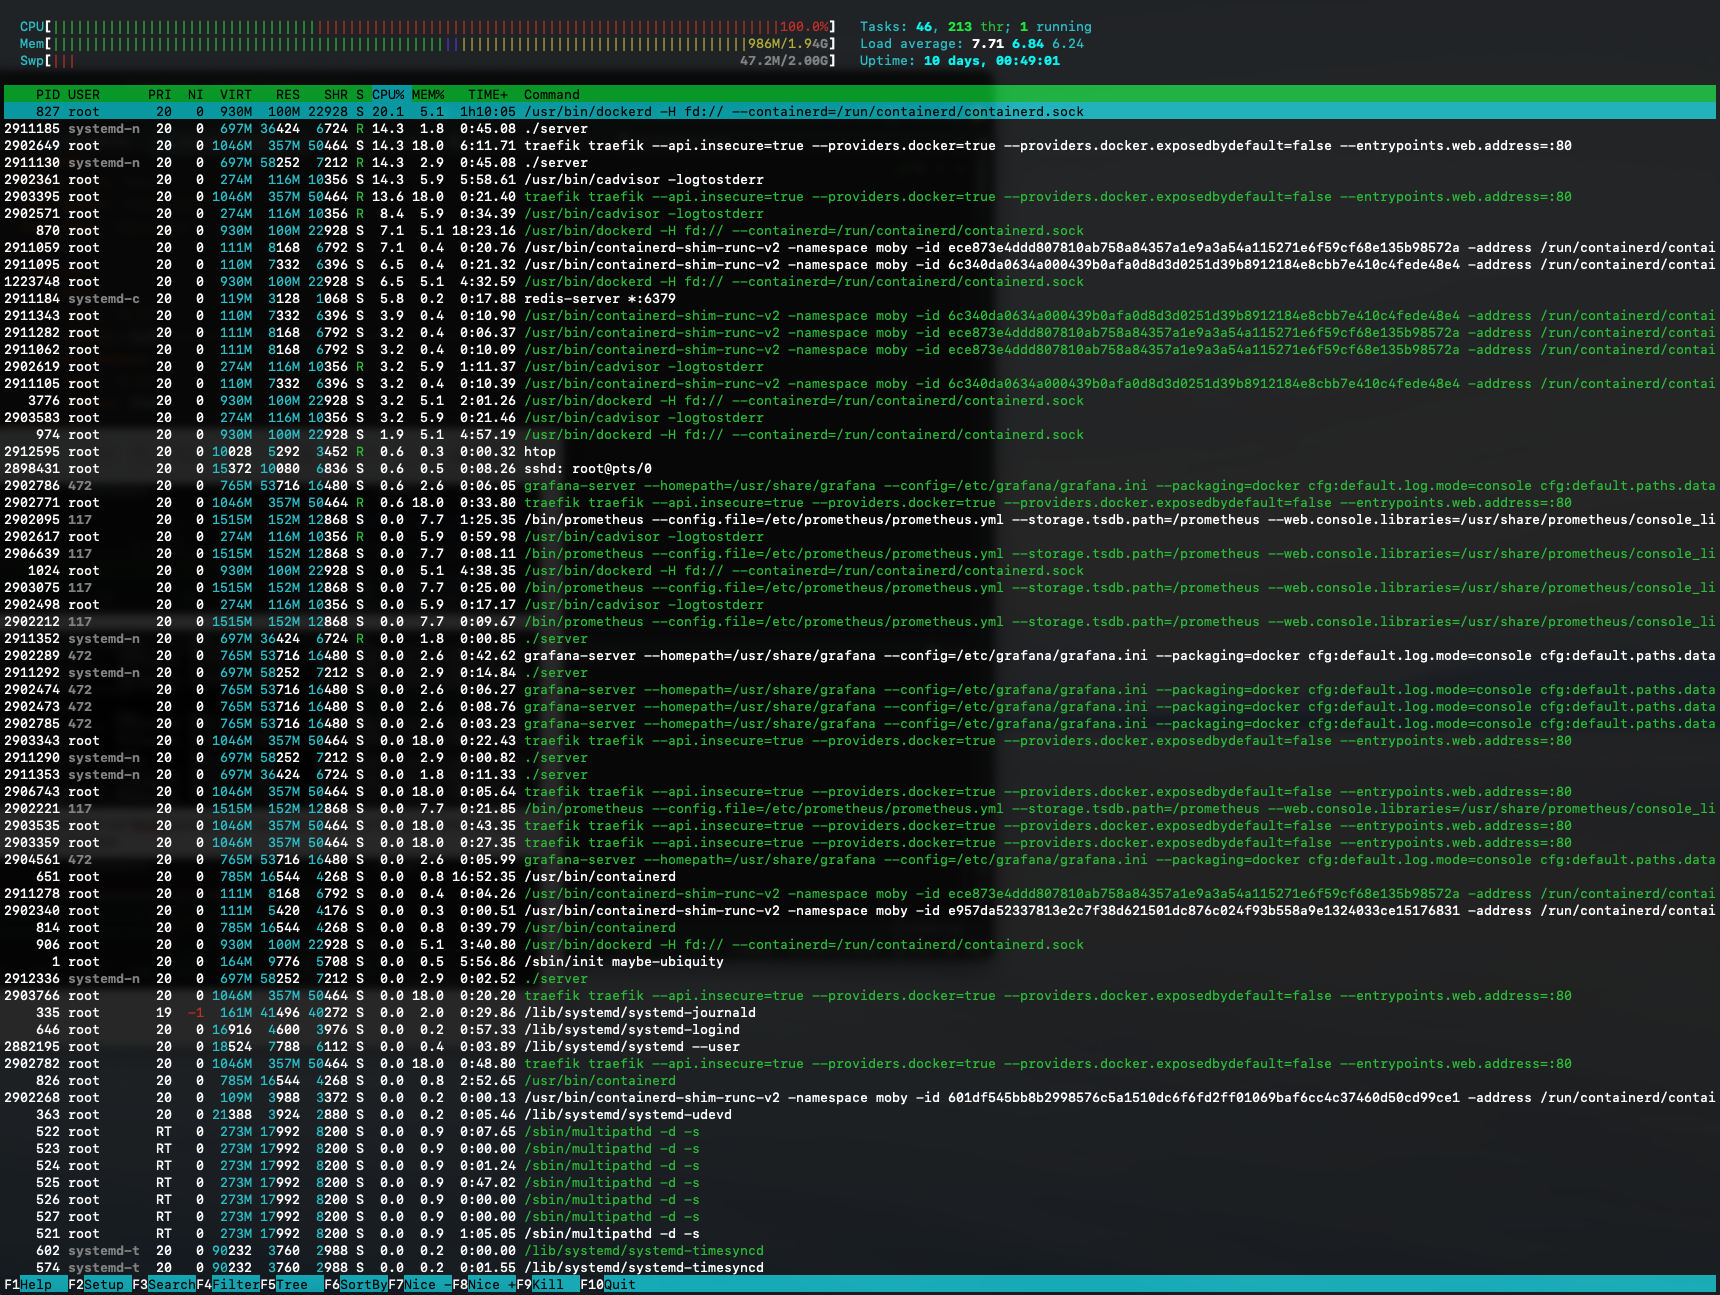
After some digging around we finally opened htop on the host server to see how our
host machine was doing. The CPU usage was at 100%, the load average at 7.75. Dammit!
We realized that we hadn’t really looked at the hardware specs of the machine that we loaned from the university for these tests. One glance at the CPU info was enough for us to plunge into disbelief. What we had here in front of us was a virtual machine with only one CPU core with 2.4 GHz.
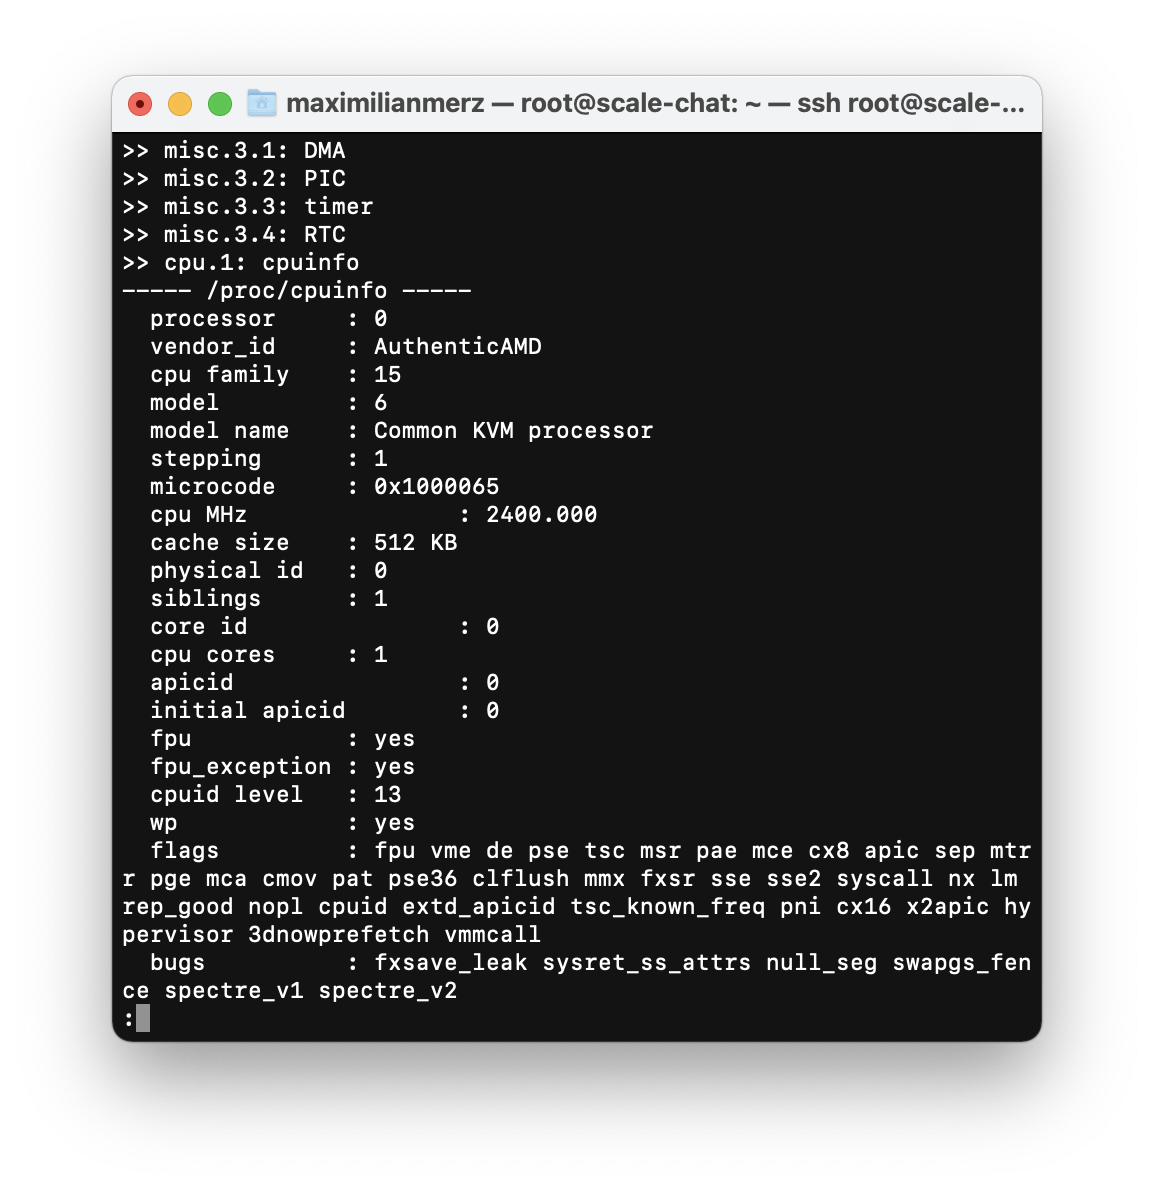
We simply did not think far enough. We had not one looked at the hardware specs of our testing machine when planning a load test like this. Ouch! That won’t ever happen to us again.

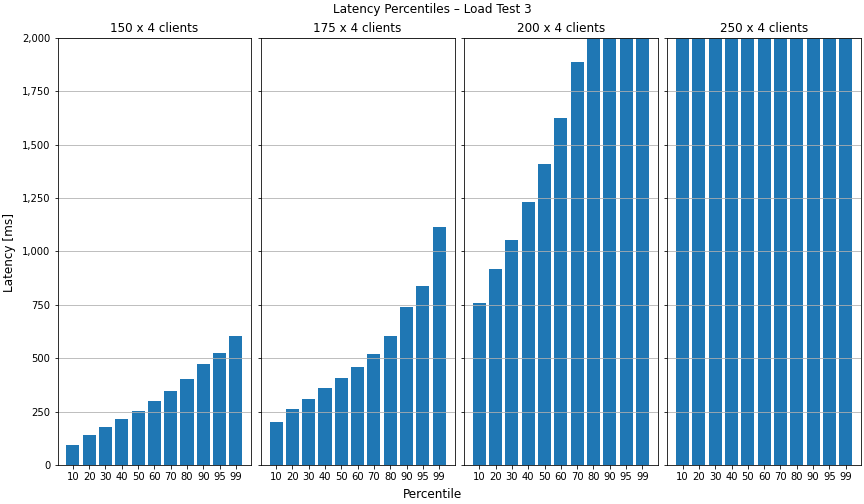
For the sake of completeness, let’s have a quick look at the load test client’s visualized results. As expected, we can see that the latency exceeds our 2 second treshhold in the 80th percentile for 200 rooms with 4 clients per room. For 250 rooms, even the 10th percentile exceeds the 2 second mark.
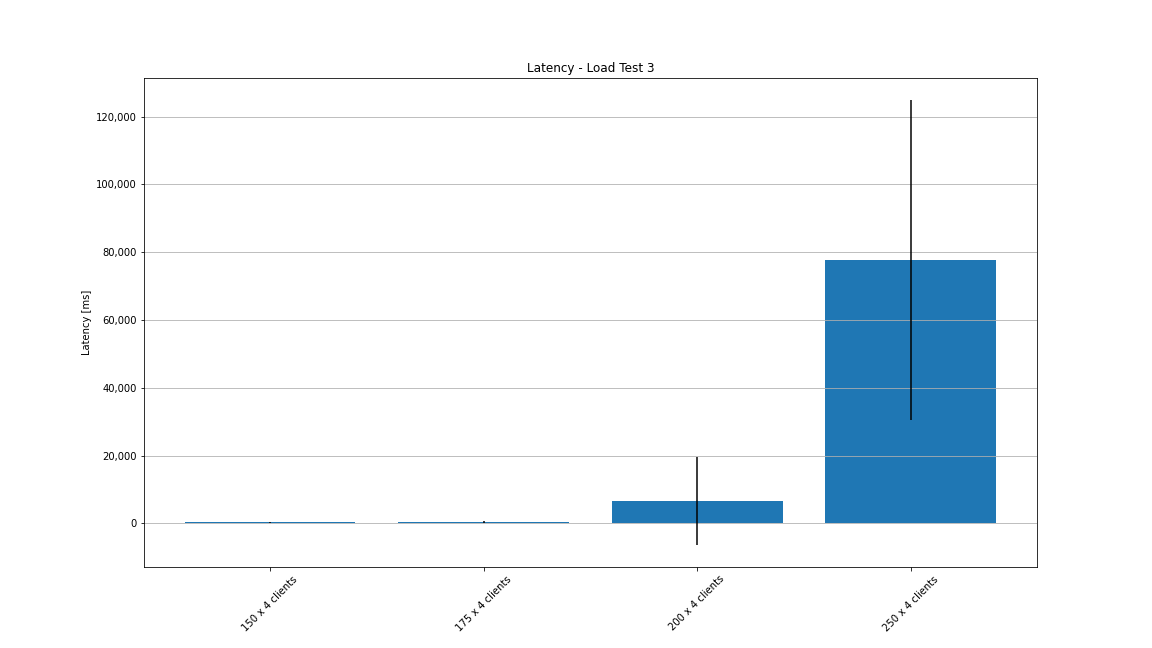
As you can see in the mean latency graph, the average latency for 250 rooms was at about 80 seconds with a standard deviation of over 40 seconds.
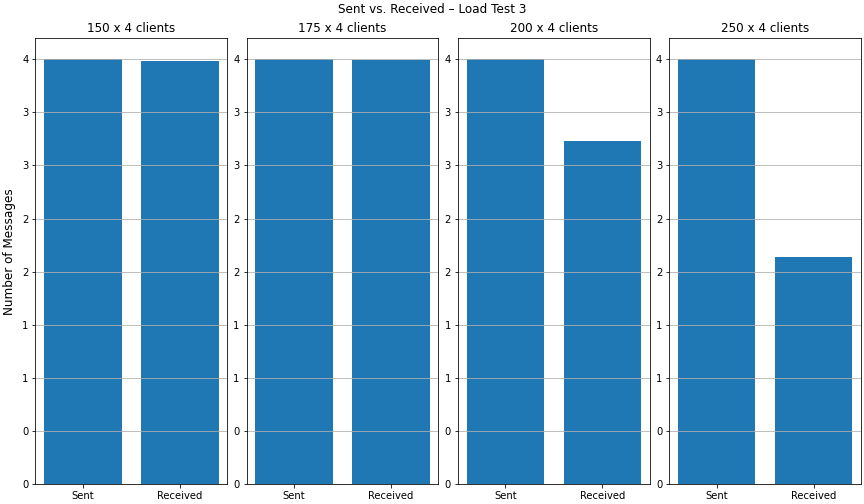
Finally, it won’t come to a surprise that some messages got lost when comparing message counts for 200 and 250 rooms.
Conclusion
This project really took an unexpected turn. In the beginning, we wanted to see how stateful WebSocket connections can be scaled and thought, we would set up a simple load test. And while we’re at it, we could do it in Go and learn a new programming language along the way. We now know that load testing software is a lot more work than we originally anticipated. And when you’re simultaniously learning a new programming language with new concepts and paradigms, it can sometimes be a little overwhelming.
To compensate for our newfound knowledge gaps, we shifted the focus of our project on monitoring and load testing in a more general view. We learned a lot from this project – just not what we first thought we would when we set out to do this. Scaling issues with WebSocket connections, which were our initial impulse for the project, never became a problem since we never got to this bottleneck. However, we encountered lots of other challenges during the project. Often times, problems will arise that are outside of your comfort zone when doing something like this. But we overcame every single one. And we took away a lot of knowledge along the way.
What would have been interesting is to execute load tests with changes in the message size and frequency. Or test with different loads for each client, creating "hot keys". Unfortunately, we didn’t have enough time to try all of that.
If there is one thing to remember from this blog post though: always inspect your hardware specs thoroughly to see what your machines are capable of before planning a load test of any kind.
At the very end, a quick word on that new language we learned: Go is an awesome
language and we like it very much. Although you have to give up some convenience
you might be accustomed to. And you have to get used to things like instant
error handling everywhere. Looking at you, if err != nil. But other then that,
Go is great and we encourage everyone to try it.
Leave a Reply
You must be logged in to post a comment.