How we used Zig as a build system, Emscripten for the web, and Python for automated visual regression testing on a C-based path tracer.
1. Introduction
Writing a path tracer from scratch in C is a fantastic way to learn the physics of light simulation. But maintaining that project, ensuring it builds across platforms, catching memory leaks, deploying it to the web, and proving the math remains correct after every commit, is where the real engineering challenges begin.
We built Tracy, a cross-platform, multi-threaded C11 path tracer. While constructing the path tracer itself caused its own challenges, this post isn’t about the math of rendering but about the infrastructure surrounding it. Here is how we used reliable tools like Python to build a visual CI/CD pipeline, while using the project as a sandbox to experiment with bleeding-edge, not quite production-ready tech: using Zig to replace CMake, and Emscripten to bring heavy, multi-threaded native code to the browser, along with the hard truths we learned along the way.
2. Ditching CMake: Zig as a C Build System
If you have ever built a C project of reasonable size, you know the traditional drill. You start with a simple, elegant Makefile. It works beautifully until you need cross-platform support, dependency management, or WebAssembly compilation. At that point, developers usually surrender and migrate to CMake, bracing themselves for a clunky scripting language that often feels like it’s fighting against you.
Since we wanted to compile our path tracer, Tracy, for Linux, Windows, and the web, we needed a modern alternative. For that purpose we chose Zig.
Even though Tracy is written almost entirely in C11, Zig acts as a drop-in C/C++ compiler (zig cc). More importantly, it features a build system where configuration files (build.zig) are written in a proper, strongly typed programming language. There are no weird macros or string-matching hacks; just standard, imperative code.
The Performance Hunt
However, it wasn’t all sunshine and rainbows from day one. When we first migrated from our quick-and-dirty Unix Makefile to Zig, we noticed something alarming: Zig’s ReleaseFast mode (the build profile for maximum execution speed) was actually running slower than our previous clang -O3 -march=native -flto Makefile setup. In a path tracer, where millions of ray-scene intersections occur every second, this was a major issue.
We dug into the build graph and realized the problem lay in our linking strategy, specifically regarding our random number generator (RNG). Monte Carlo path tracing requires millions of random numbers per pixel. Initially, we were building our RNG dependency (the PCG library) separately and linking it to our library afterwards. This isolated the optimization steps, creating a boundary that prevented the compiler from applying a crucial optimization (inlining the frequent RNG calls).
Typically, the modern solution for crossing this compilation boundary is Link Time Optimization (LTO), but enabling it in Zig wasn’t enough to fully catch up to the performance of the raw clang command. Instead, we bypassed the linking step entirely by forcing a “Unity build”. We compiled the PCG source files directly alongside tracy.c, which guarantees the compiler can apply the previously mentioned optimizations.
With these optimizations we not only matched our old Makefile performance, but the Zig build actually ran faster.
Ultimately, we created a single build.zig file that generates our native C binaries and orchestrates our entire Zig-based test suite.
However, we do have to admit one engineering reality check: our build.zig does not currently handle our WebAssembly target. While Zig has impressive cross-compilation capabilities, we hit a roadblock trying to get it to compile our OpenMP multi-threading directives for the web. Rather than fighting the toolchain, we made the pragmatic choice to rely on Emscripten (emcc) for the web build, orchestrated with Vite using standard Node.js scripts.
3. White-Box Testing C Code with Zig
Testing C code is a well-solved problem, but it usually involves reaching for third-party frameworks like Check, CMocka, or Unity. While these tools are robust, they often require wiring up separate build targets and writing a fair amount of macro-heavy boilerplate just to assert simple math operations.
Since we were already using Zig to orchestrate our build, we decided to use its built-in test runner to test our C codebase. The integration promises to be seamless thanks to Zig’s @cImport function, which can parse C code directly.
Instead of just importing our public tracy.h header, our Zig test files import the actual tracy.c source file. This allowed us to perform true white-box testing. We could instantiate internal C structs and write tests for private geometry intersection functions without exposing them in our public API or restructuring our codebase.
The Free Sanitizer Catch
Initially, this setup felt great thanks to Zig’s compiler automatically instrumenting the code with safety checks similar to C’s Undefined Behavior Sanitizer (UBSan).
This saved us from a notoriously difficult-to-debug graphical glitch early on. During our global HDR to LDR tonemapping phase, a calculated pixel luminance value was slightly exceeding its bounds before being assigned to an 8-bit unsigned integer. In our previous standard C compilation, this value silently overflowed, resulting in yellow speckles in the brightest parts of the generated images. Because of Zig’s automatic runtime safety checks, it caught the overflow instantly and pointed us to the exact line of C code that caused the issue.
While enabling tools like UBSan in a traditional C setup is as simple as adding a compiler flag, having these checks baked into the default zig build test command ensures that safety isn’t an opt-in configuration you have to remember to enable.
The Reality Check: Zig’s Rough Edges
However, our enthusiasm was eventually tempered by reality. While @cImport sounds like magic, relying on a pre-1.0 language for complex C interop comes with severe limitations that made us question its production readiness.
The first major issue was with Zig’s translate-c engine. In our C code, we define our scenes using C99 designated initializers combined with unions (e.g., {.shape.type=TRIANGLE, .shape.data.triangle={...}}). The Zig translation engine completely choked on this syntax. Instead of failing gracefully, it fell back to declaring our scene definitions as extern variables, causing “undefined symbol” errors from the linker. To fix it, we had to introduce a terrible hack: exporting dummy, zero-length arrays from Zig just to satisfy the linker so our unit tests would compile.
While this is problematic and should be fixed on Zig’s end, the most dangerous issue was the caching system. The absolute worst thing a test suite can do is give you a false positive. At one point, we modified the implementation in tracy.c and ran zig build test. The tests should have failed here, but everything passed. We later realized that Zig’s build cache had failed to detect the change in the underlying C file and simply re-ran a cached test executable. We had to nuke the .zig-cache to get our tests to fail properly, and we eventually disabled caching for the unit tests in our CI pipeline to avoid being lied to.
Ultimately, using Zig to test C code is a fascinating concept that yields DX wins. But until the translation engine and the build cache mature, it remains a tool that you have to handle with care.
4. Visual CI/CD: The Quest for Physical Correctness
While unit testing individual C functions with Zig is fantastic for ensuring our vector math or ray-sphere intersections are mathematically sound, it falls short of validating the renderer as a whole. A microscopic bias in a material calculation or a missing cosine term in the integration loop might easily slip past isolated unit tests, yet completely break the physical accuracy of the final image.
To guarantee the entire system works from end to end, we rely on image-to-image comparison. To test if a rendered image is “physically correct” we compare it to a ground truth. For this, we use Mitsuba 3, an industry-standard, heavily validated research path tracer. By recreating our test scenes (geometry, materials, and lighting) exactly in Mitsuba’s XML format, we generate “golden” reference images. Crucially, we output these as EXR files to preserve the raw, floating-point High Dynamic Range (HDR) light data. Comparing Tracy’s output directly against these references allows us to test the entire rendering pipeline in one go.
Choosing the Right Metric
While relying on human visual inspection alone is possible if you know exactly what to look for, it’s highly subjective and error-prone. This manual approach is better suited for optimizing the look and feel (e.g., for a video game) rather than mathematical correctness.
Humans are surprisingly bad at spotting math errors in rendered images, especially in high-contrast areas. This is mostly due to the brain’s filtering of visual information; we are hypersensitive to contrast and edges but relatively blind to subtle shifts in uniformly colored surfaces or specific color channels where the eye has lower sensitivity. In cases where human-perceived quality is the main goal, perceptual metrics for image-to-image comparison such as SSIM or the more modern FLIP developed by NVIDIA can be used. These try to mimic the human “filter” to automate the evaluation process.
For Tracy, we need to know that our math is actually correct, not just that it looks pleasing to the eye. Human perception was no longer a sufficient benchmark, so we shifted our focus from perceptual metrics to physical ones.
We initially looked at Mean Squared Error (MSE), but standard MSE is notoriously biased toward bright pixels in HDR rendering. A tiny error in a bright area would spike the score, while a massive error in a dark shadow might go unnoticed. To fix this, we implemented Relative Mean Squared Error (RelMSE), which normalizes the error across extreme HDR brightness levels. This serves as an objective measure of physical accuracy against our Mitsuba-generated ground truth.
Ultimately, we landed on a comparison to a ground-truth image using relMSE, which distills the quality of the entire render into a single, objective score.
Difference Maps
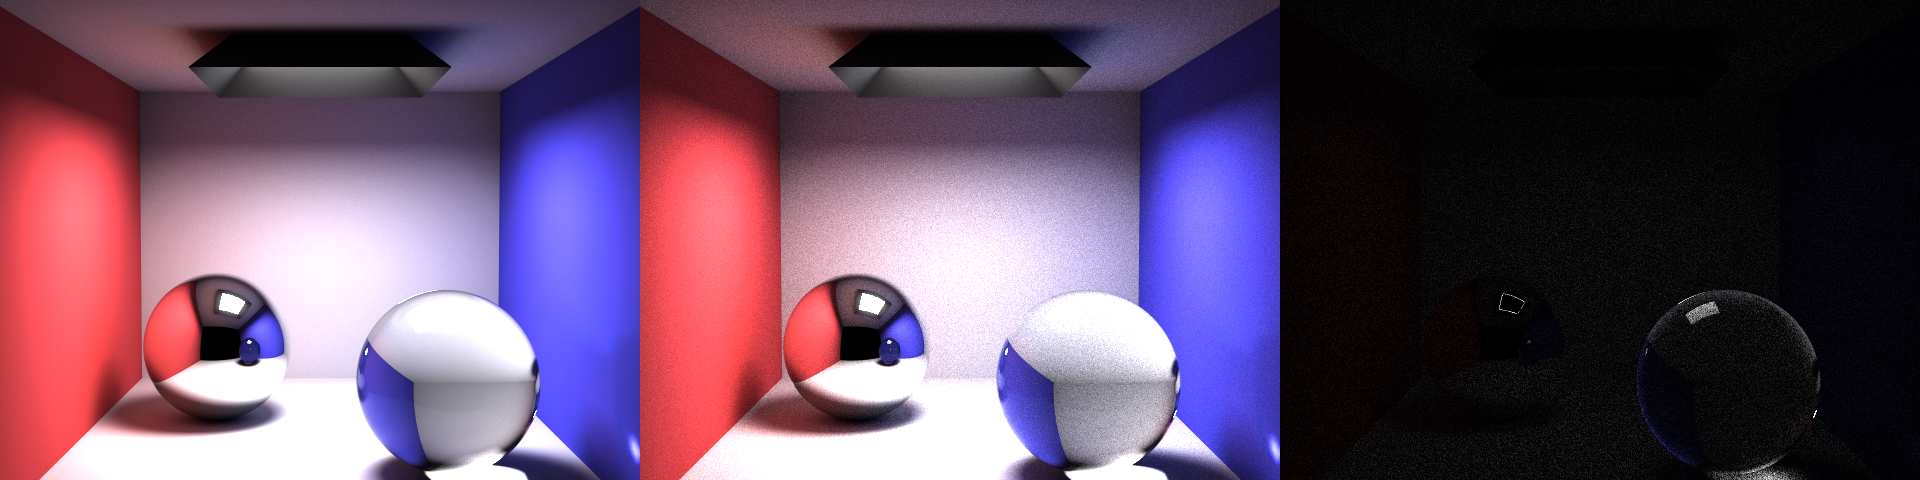
A single error score does tell you that something is wrong with the rendered image, but for pinpointing the error you need a visual representation. For this purpose, we generate difference maps. By comparing our render against the Mitsuba reference pixel-by-pixel, we produce an image where bright areas represent high error and dark areas represent high accuracy. This allows a developer to instantly see if a bug is localized to, for example, refractive surfaces or certain light sources.
This comparison image below perfectly illustrates why relying on the naked eye is a trap. Looking at our render in the middle panel, the scene appears completely fine. The lighting, shadows, and glass all look subjectively “correct.”
However, the difference map on the right reveals the mathematical reality. It highlights two distinct types of errors: the faint, grainy texture across the walls is simply expected variance (standard Monte Carlo noise). However, the glaringly bright ring around the edge of the glass sphere is a systematic failure. It instantly exposed a subtle bug in our Fresnel reflection logic at grazing angles. Without image diffing, a physical inaccuracy like that could have easily gone unnoticed.
For even more precision, we could instead generate error heatmaps, applying a configurable color gradient that makes subtle flaws more obvious, but currently we are still using simple difference maps.
While RelMSE gave us a performance score, running metrics manually across every commit was not scalable. To make certain our math stayed correct and performant as the codebase grew, we integrated benchmarking, unit tests and logging directly into a GitHub Actions CI/CD pipeline. By archiving these metrics on every push, we laid the groundwork to automatically generate trendline graphs that visualize our renderer’s improvements over time and catch regressions at a glance.
Continuous Integration
We build our binaries inside a dedicated Docker container. This ensures that library versions, system configurations, and compiler toolchains remain identical for every run, preventing the “it works on my machine” issue. The pipeline executes benchmarks based on a YAML configuration file that defines target scenes, and path tracing settings.
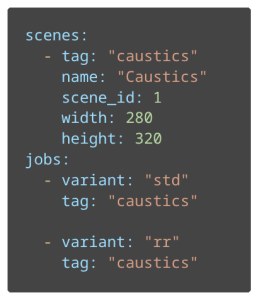

This example shows a simplified configuration of a scene named “Caustics” as well as two rendering jobs, each with a different configuration (std – Standard, rr – Russian roulette ray elimination).
At the end of the CI step all of the important files get exported as run artifacts. This includes raw benchmark logs (error scores and timings) alongside PNG versions of the rendered images, reference images, and difference maps.
However, path tracing is a computationally expensive task, so to keep the pipeline from feeling sluggish we included two main optimizations:
- We only rebuild the benchmark container if the Dockerfile actually changes. Otherwise, the pipeline pulls the existing image from the GitHub Container Registry (GHCR), saving minutes of environment setup.
- We use GitHub’s cache to store Zig’s compilation artifacts and Docker Layer Caching for both the CI and CD step. This allows the runner to reuse intermediate layers, ensuring that small code changes don’t trigger a full, redundant container build.
Dashboard
Generating logs and previews during CI is well and good but having to go through each pipeline run’s artifacts and analyze by hand is a chore. We needed a way to track our progress over time without bloating our main branch with thousands of images and CSV logs.
That’s why we decided to include a dashboard for storing and visualizing all of the data generated by the CI Step. Our solution was to use a Git Orphan Branch. Unlike a standard branch, an orphan branch shares no history with main which makes it ideal for storing data while excluding the codebase. That way, the repository retains a clean distinction between the code and the pipeline data.
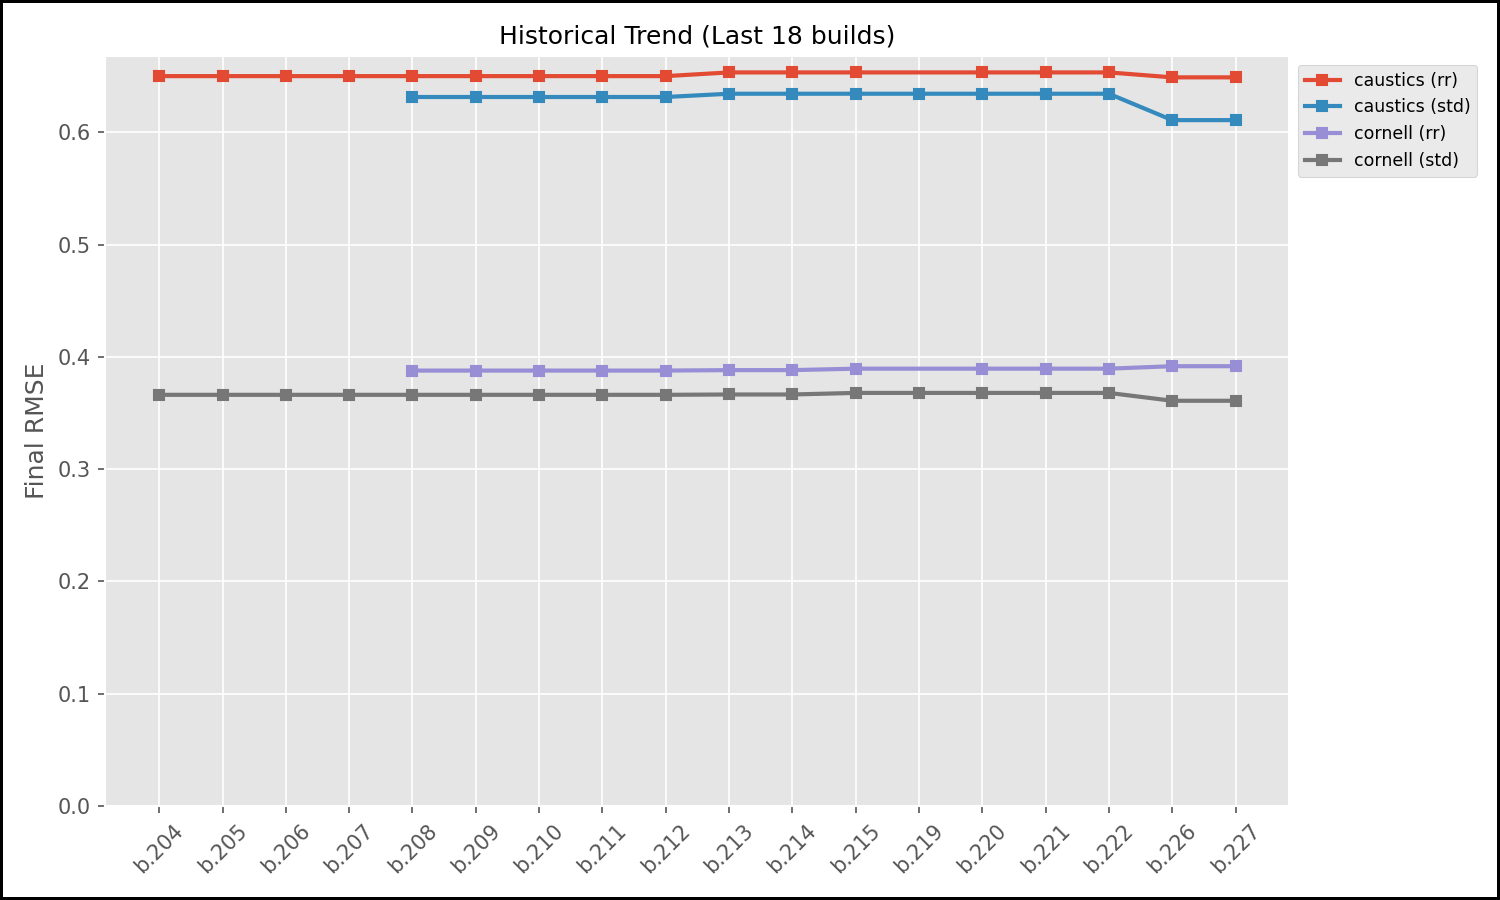
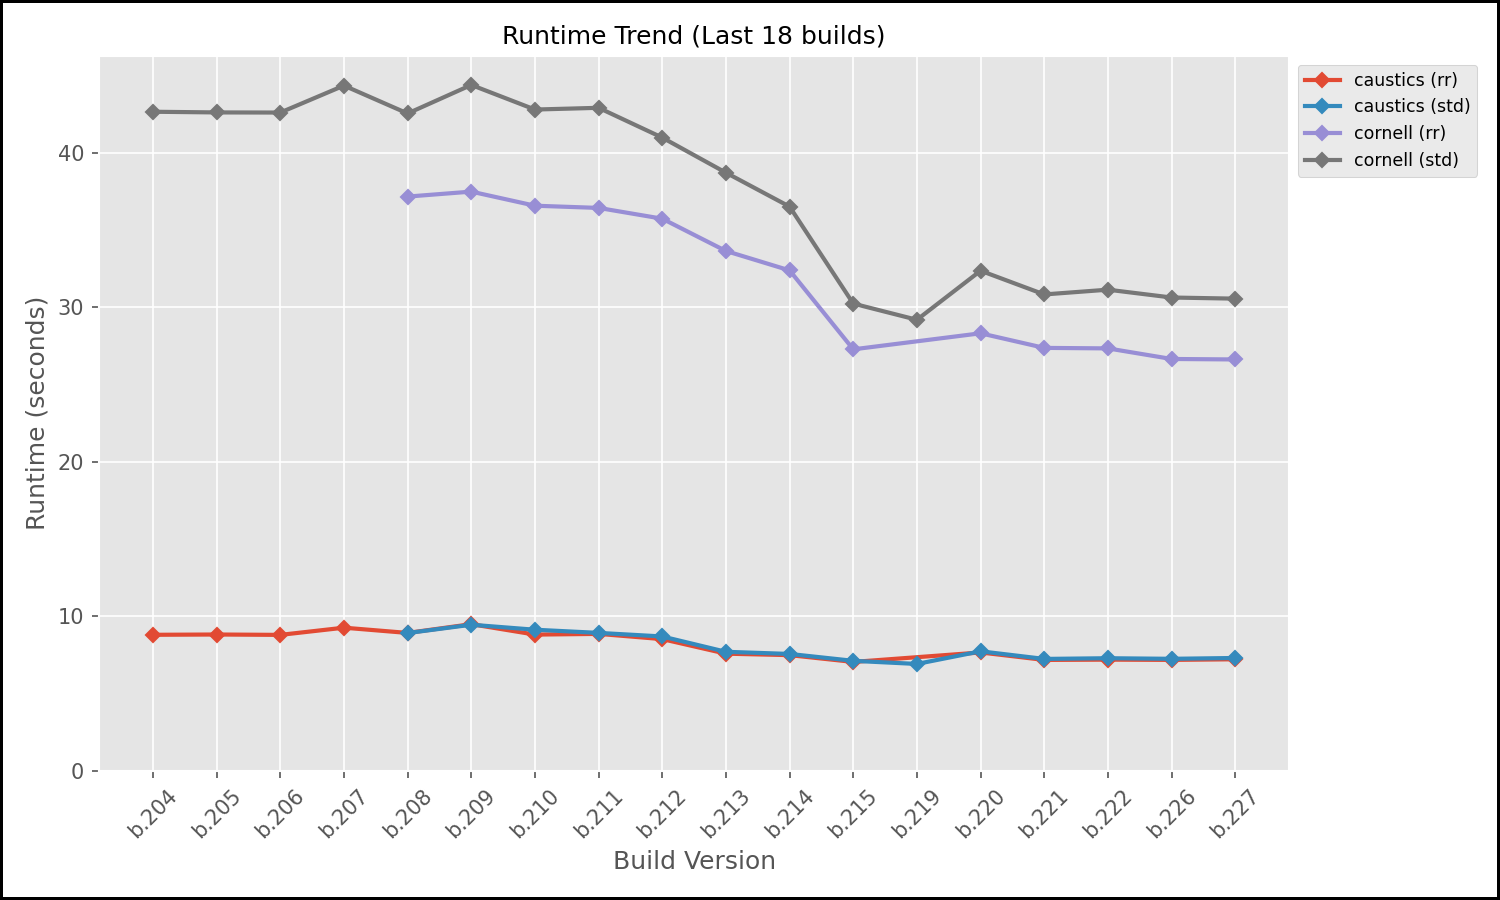
For visualization we set up a Python script that runs at the end of the CI Pipeline. It parses the historical data and generates trendline plots and tables showing our rendering accuracy and runtime performance over the life of the project.
The following graphs are two of the generated graphs displayed in the dashboard. They show the trendlines for a section of commits for two scenes (caustics, cornell) in two configurations each (std, rr). While the RelMSE stayed relatively consistent with one minor improvement in a recent change of the path tracer, the runtime trend on the other hand shows a steady improvement in speed, especially on the cornell scene (brown and purple lines).
To automate the maintenance of the dashboard, we set up the GitHub Actions runner to process and push benchmarks results to the benchmarks (orphan) branch. The pipeline builds the C code from the main branch, runs the path tracer but then uses the actions/checkout tool to checkout the benchmarks branch into a sub-directory. It appends new RelMSE scores to a history.csv and copies over the latest generated images to the orphan branch. It then runs another Python script that dynamically updates the README.md file on the orphan branch, embedding the newly generated graphs and linking to the latest renders, creating a live dashboard. Instead of analyzing raw data, a developer can simply switch to the benchmarks branch and instantly see how their latest refactor affected physical correctness and render speed of the path tracer.
This dashboard moves our CI from a simple benchmarking step into a detailed history of the path tracer’s evolution. It provides a transparent, objective look at our progress both for developers and anyone else following the project’s development.
Continuous Deployment
The CD part of the pipeline triggers only after the benchmark step passes. It compiles Tracy’s Web version and injects it into a lightweight nginx:alpine image. By using a multi-stage build, we can exclude the heavy build toolchains (like Emscripten and Zig) from the final artifact, keeping the deployment footprint minimal. The image gets uploaded to the GHCR afterwards. For both setting up the CI docker image as well as the deployment we make use of Docker Layer Caching to save some extra time by reusing docker layers still present in the GitHub cache.
5. From Terminal to Browser: WebAssembly & Shared Memory
Making a C-based path tracer accessible via a zero-install web URL presents a modern take on a traditionally native application. Using Emscripten, we compiled our core renderer into WebAssembly (WASM) so it could run directly in the browser. While cool in concept, rendering is a heavily blocking operation so if you run it on the main thread, the browser UI instantly freezes.
Besides just displaying one generated image in the browser, the web application should also feature real-time interaction (rotating the camera). Our solution was to spawn the WASM module inside a Web Worker. However, passing high-resolution image frames back and forth between a worker and the main thread via standard message passing (serialization) is far too slow for that purpose.
We aimed for a zero-copy architecture using a SharedArrayBuffer (via Emscripten’s -sSHARED_MEMORY=1 flag). Our C backend writes pixel data directly into a shared block of memory, and the TypeScript main thread creates a Uint8ClampedArray view over that exact same memory block.
But here is the catch: browser APIs enforce copying the image. The HTML5 <canvas> ImageData constructor refuses to accept a shared memory view. We are forced to manually copy the data out of the shared buffer on the main thread before painting it. Not only does this add a slight performance overhead, but it also introduces a race condition: The worker might write new pixels while the main thread is copying the array. However, as this is extremely unlikely to happen and has no problematic impact, fixing the issue (using double buffering) is currently not a priority. Still, bypassing message serialization keeps the process fast enough.
The Multi-Threading Roadblock
Natively, our C code gets its speed from OpenMP directives like #pragma omp parallel for to utilize multi-threading. Unfortunately, Emscripten doesn’t officially support OpenMP yet (though there is a recent PR waiting to be merged).
Instead of rewriting our entire threading model using raw POSIX threads, we opted for a pragmatic solution. We used SimpleOMP, a lightweight library that implements the subset of OpenMP we needed (parallel loops and atomics) on top of Emscripten’s existing pthread support.
Developer Experience and the Reality of High-Performance Web
Debugging compiled C code inside a browser sounds like a nightmare, and honestly, it kind of is. While it is technically possible to set breakpoints and step through your raw C source code using the C/C++ DevTools Support (DWARF) extension for Chrome, the overall experience is incredibly cumbersome. The setup is finicky on Chrome and on Firefox we unfortunately didn’t get it to work at all. In the end, the friction was too high. We abandoned browser-based debugging entirely, adopting a workflow where we test and debug all our C code natively using standard debugging tools, such as GDB.
Ultimately, our WASM implementation reached roughly 75% of our native performance, which is an impressive feat for a web application. The WebAssembly ecosystem is undeniably powerful, but pushing it to its absolute limits with multi-threading and shared memory requires going through web development hell and accepting compromises.
6. Conclusion
Developing a path tracer from scratch means writing highly complex, mathematically dense C code. As we actively built out this project adding new rendering features and continually optimizing our library for speed, the risk of introducing subtle bugs was incredibly high. Writing complex systems is one thing but guaranteeing they remain correct across hundreds of commits is another.
This is where our automated CI/CD pipeline paid off: It wasn’t just a fun DevOps side quest but instead became our primary development safety net. As we switched to multi-threading for performance or tweaked our core path tracing logic, the dashboard was there to keep us on course. The visual difference maps and RelMSE trendlines caught subtle regressions that our eyes would have missed, proving that our performance optimizations actually worked without breaking the underlying math. It turned subjective guessing (“Does this shadow look right?”) into objective, actionable data.
None of the tools we adopted were flawless, but they solved pain points in the traditional C workflow. Zig successfully replaced the clunkiness of CMake and gave us built-in memory safety for native unit testing, even if its C-translation and caching aren’t entirely bulletproof yet. On the deployment side, Emscripten brought our computationally heavy code to the browser, though pushing WebAssembly to its multi-threaded limits meant navigating a minefield of API quirks. Finally, our Python and GitHub Actions pipeline automated the hardest part of graphics programming: verifying visual and mathematical regressions.
Replacing manual workflows with automation transformed how we maintain our C path tracer. While Zig showed us that the gap between low-level systems programming and modern developer experience is finally closing, Emscripten taught us the true pain of high-performance web development.
You can try out the interactive Web demo right here. If you want to see how we track physical correctness, check out our automated benchmark dashboard, or dive into the source code on our GitHub repository.
Leave a Reply
You must be logged in to post a comment.