Introduction
Imagine building a service that aims to generate as much user traffic as possible to be as profitable as possible. The infrastructure of your service usually includes some kind of backend, a server and other frameworks. One day, something is not working as it should and you can’t seem to find out why. You spend a lot of time on testing and finally, after a couple of hours, you find the solution – but already have lost a lot of profit.
This loss of time and profit could have easily been prevented by a simple principle: Monitoring.
Monitoring can be described as the process of collecting and displaying data of your system e.g. in the form of metrics. Metrics are measurements of resource usage or behavior within systems, ranging from low-level operating system data like CPU-Usage to higher-level application-specific information like request rates. [1]
Why should you consider monitoring your system?
It helps analyze long term trends, like the development of daily active users. It will alert you if something is broken and you need to fix it. And you can build a dashboard that describes your system including the four golden signals, the foundational building blocks of an effective monitoring strategy.
According to Google Site Reliability Engineering the four golden signals are:
- latency: the time it takes to respond to a request
- traffic: the amount of demands that are placed by users to your service
- errors: the fail rate of the requests
- saturation: for example the amount of memory that is being used at a given moment [2]
How did we approach monitoring in our project?
There are several tools that can be used for system monitoring, like Prometheus. We choose Prometheus because it is an open-source monitoring and alerting system, easy to integrate in different project architectures. It scrapes metrics (collecting and saving them) and stores them as time-series data. [3]
For context: for our students project we developed a simple hosting provider that enables users to start Docker containers on a remote server using a simple CLI tool.
We have added a simple monitoring process as seen in the picture below:
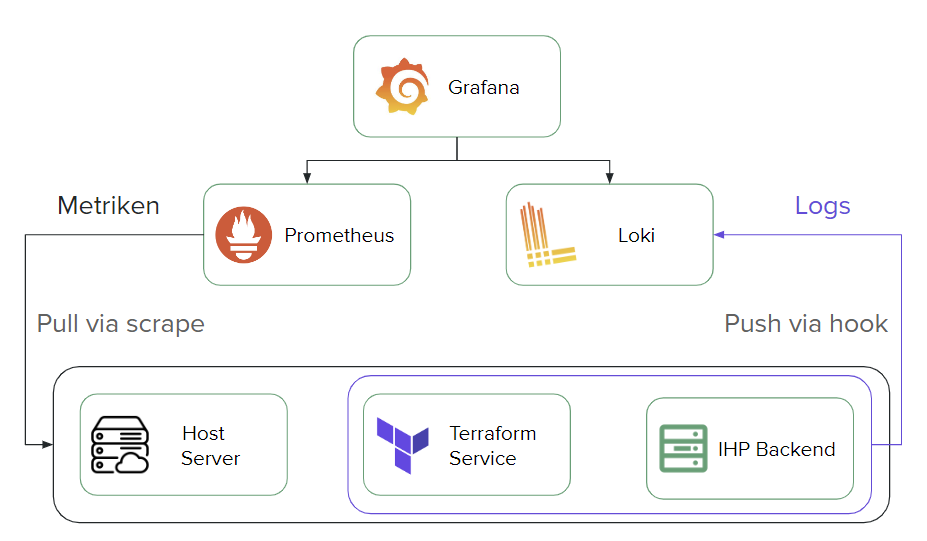
Our project includes a host server, a terraform service and a go-based backend. To make it possible for Prometheus to pull metrics via scrape, we added a metrics-endpoint to our services with the help of go-gin-prometheus. Choosing go-gin-prometheus was the best choice for us, as our backend is already gin based and it made it easy to integrate our http-metrics-endpoint. Alternatively you could use the official Prometheus go client library. We added a prometheus instance to our docker-compose file, pointing to a prometheus.yml-file that contains our prometheus configurations like scraping-interval or our scraping target.
To display our metrics we used Grafana for creating a dashboard. At the beginning we added a remote_write configuration to our prometheus.yml file. This configuration includes a remote_write endpoint url that directs the metrics to the Grafana Cloud, making it possible for us to access the metrics in an online dashboard and configuring it in the grafana web application. However in the end, we decided to create our own grafana instance in the docker-compose file, as standardized for every service in our project. This makes it possible for us to create a reproducible environment and to define our dashboard within a JSON file, pushing it to our grafana instance.
Conclusion
In conclusion we can say that monitoring is a very important aspect in system engineering. It ensures a healthy system providing us with the necessary metrics and alerting us in case of any issues happening. As every system is different there is no standard way of implementing it so you have to make sure to integrate the services, configurations and metrics that are the most suitable for your use case.
Further readings
If you want to know more about the other aspect of monitoring, observing the Log Data with Grafana-Loki, as displayed in the picture above, check out this blog: https://blog.mi.hdm-stuttgart.de/index.php/2024/02/29/combining-zerolog-loki/
Other aspects of our projects include user authentication with keycloak and starting docker containers with terraform.
References
- [1] J. Ellingwood, „An Introduction to Metrics, Monitoring, and Alerting“, DigitalOcean, 5. Dezember 2017. https://www.digitalocean.com/community/tutorials/an-introduction-to-metrics-monitoring-and-alerting
- [2] Google, „Google – Site Reliability Engineering“, 2017. https://sre.google/sre-book/monitoring-distributed-systems/.
- [3] Prometheus, „Getting Started with Prometheus | Prometheus“. https://prometheus.io/docs/tutorials/getting_started/
Leave a Reply
You must be logged in to post a comment.