The last two years in software development and operations have been characterized by the emerging idea of “observability”. The need for a novel concept guiding the efforts to control our systems arose from the accelerating paradigm changes driven by the need to scale and cloud native technologies. In contrast, the monitoring landscape stagnated and failed to meet the new challenges our massively more complex applications pose. Therefore, observability evolved as a mission-critical property of modern systems and still attracts much attention. The numerous debates differentiated monitoring from observability and covered its technical and cultural impact on building and operating systems. At the beginning of 2019, the community reached consensus on the characteristic of observability and elaborated its core principles. Consequently, new tools and SaaS applications appeared marking the beginning of its commercialization. This post identifies the forces driving the evolution of observability, points out trends we presently perceive and tries to predict future developments.
Let’s briefly reiterate the basics of observability: Whereas monitoring provides information whether a system is operating as expected, observability encompasses the research why an application behaves in a certain way. Akin to scalability and resilience, it is a system property. Observability allows engineers to explore systems and answer questions yet to be formulated when the code was deployed. Hence, it is about the unknown-unknowns. It makes applications comprehensible and enables humans to understand the internals of the system just by reasoning about it from the outside. [2,7]
Forces
Before we focus on current trends it is advisable to explore the main motives driving the observability movement. Please note, that the factors outlined below do not concern every system equally. They depend and mutually reinforce each other.
Scale and accelerate, or die
In the last two decades customers of IT services and products continuously elevated their expectations concerning availability, performance and velocity of new features. Nowadays, users scarcely tolerate downtime, degraded performance or infrequent release cycles for new features and bug fixes. Falling behind the competition in one of these dimensions displeases the customers and thus can potentially ruin the business. Naturally, users don’t want to suffer any disturbance during the release of new features and expect them to work properly right away [5,7].
Internet companies are assessed by their revenue and growth of paying customers. Consequently, it is their primary goal to attract and retain users, scale their platforms to handle even more traffic and improve fault tolerance as well as their feature velocity. This necessitates the relentless optimization of every part in the entire application including processes for development and operations. Current trends such as edge computing, probabilistic algorithms, relaxed consistency and DevOps are the practical results of the efforts to improve the systems in different dimensions. Products of the cloud-native movement such as Docker and FaaS drastically reduce the lifetime of components and therefore leave engineers with even more dynamic and ephemeral systems. Additionally, users demand enhanced interoperability between the actual application and third-party services or SaaS products. The adoption of hybrid approaches combining infrastructure on premises and serverless applications in public clouds further elevates complexity, because external systems offer limited capabilities for monitoring and observability.
The architectural pattern of Microservices emerged since organizations were forced to scale their applications horizontally and because they needed to reduce the dependencies between teams caused by a monolithic design. By slicing the application into small and loosely coupled services the teams can develop and deploy software more independently. Suddenly, polyglot services with different programming languages, auxiliary tools and storage systems are widely adopted and aggravate the observability of the platform. Additionally, incoming requests can affect many services and involve additional communication over the network. This creates the need to trace the request flow through all components. Since Microservices were designed to liberate teams and enable them manage software without knowing about each other, it becomes even cumbersome to evolve an observable system [24].
Failures everywhere
The ambition to maximize the availability, performance and feature velocity of systems comes with the cost of more failure modes in general and especially an increased number of gray failures. Nowadays, organizations have accepted that no system is immune to failure, hence they need to mitigate the impact and remedy the cause quickly. At the scale of modern highly distributed systems many components fail independently. To achieve high-availability, every layer in the entire application stack from the network to the application itself uses fault-tolerance mechanisms like retries, circuit breakers or relaxed consistency to abstract the failure away and render it transient to the consumer. Hard failures such as disk crashes or network outages are altered to soft, implicit failures. The performance might be degraded but the application is still able to process requests at least partly. As a result, these systems are never fully healthy, and engineers are left with even more gray failures. They are subtle and hard to locate but potentially cause unpredictable and undesired behavior many layers above the root cause. In essence, stacked layers of fault-tolerance mechanism increase the overall complexity and interfere with the ability to readily reason about a system. [4,5,6]
Improve user experience
The user experience of an application ultimately determines its success. Therefore, organizations enhance their client applications with more business logic. Single page applications are mostly employed since they enable a more responsive and adaptive behavior to the user actions and circumstances. Consequently, the importance of the client-side software rises. Malfunctions aside from the backend can still render the entire service unusable although the backend might be fully functional. Moreover, the diversity of user agents an organization may has to support increases steadily.
With the rising expectations of customers, each individual user experience matters. An annoyed customer generates less revenue than a happy one. The health of the overall system is more and more neglected because no large-scale system will ever be fully healthy. [1]
Engineering practices
Despite the DevOps movement it is still common in many organizations that different specialized teams such as database, network etc. exist and that they use different tools for monitoring and observability. They seem to ignore the fact that heterogenous tools create silos and impair collaboration. It becomes impractical to debug latency problems or failures across multiple tools with no ability to correlate data. [1]
The ease of debugging as well as the visibility into our system are an imperative requirement for the evolution of resilient systems while maintaining the quality of service for all customers. This includes the ability to correlate and explore metrics, logs and traces from all sources in a single place facilitating the engineer’s job to derive higher-level insights from the raw data. [5,20]
Following the DevOps mindset, it becomes the engineering teams’ responsibility to develop and operate their services. Observability empowers teams to genuinely own their services. It supports the “you build it, you run it” philosophy by allowing the engineers to truly understand their software including the operational consequences and its failure modes. [1,2]
In summary, the complexity of the systems we built and operate increases continuously. We deal with even more uncertainty in an accelerating world, but our monitoring tools are designed for a predictable environment. [6]
Challenges and emerging trends
Upon identifying the forces driving the evolution of observability, we will explore the resulting high-level challenges followed by a description of emerging concepts addressing the novel problems.
Improve data we base observability on
Observability involves exploring systems in unforeseeable ways and deals with the unknown-unknowns. Hence, a plethora of data forms the bedrock of any effort to better understand the behavior of a system from an outside perspective. The access to the raw events is imperative since any aggregation destroys valuable context and details. To further elaborate this requirement: context is key. Raw events with original context tell a story which is necessary to comprehend the behavior of a system. Although metrics, the aggregated form of log events, are cheap and suitable to monitor the overall health of a system, they discard context. Without context, it is impossible to trace problems throughout an application and answer question that did not exist at the time, when the metrics were aggregated. [2,7]
Besides context, the data points must offer numerous relevant fields of high cardinality such as userId, user agent, app version, source ip etc. This allows breaking down the data in manifold ways and thus can offer new insights on the extent or cause of a problem. For example, you can identify that all users from a specific country running a specific app version on a specific user agent suffer from degraded performance due to software bug. Without high cardinality it would be infeasible to narrow down the problem quickly. [2,6]
Naturally, before engineers can explore data with rich context and high cardinality, the application must emit data. Hence, a pervasive and fine-grained instrumentation of the entire system with all its components is required. Every black box within the environment must provide data to render it more transparent. At this point, affiliated third-party services can pose a challenge. Additionally, the data shall be emitted in a structured fashion to increase the efficiency of processing and to allow versatile transformations. Structured logging is a prominent example. [2,6]
Cope with the collected data
As Daniel Bryant points out in his tweet, designing an observability system is considered a major engineering challenge. With the scale of modern applications crafting an observability strategy requires a compromise between high-throughput, high cardinality, lengthy retention window and unsampled data. [28]
Logs, as one of the three pillars of observability, produce an enormous amount of data that needs to be ingested, preprocessed and stored. Executing queries demands additional resources. As an organization, you can either invest the engineering effort to scale the log management or employ SaaS vendors such as loggly or datadog. [12]
Since logs constitute a continuous stream of events, many organizations apply a stream processing approach to address the problem of large data volumes and to derive insights from the data. Placing a broker platform such as Apache Kafka in the center of a log pipeline adds a dynamic and scalable buffer that protects the ingestion of the persistent storage from overload and allows real-time analysis of the log stream. Netflix for example, addressed their scalability issues by implementing a real-time stream processing platform termed Mantis. The release of Loki by Grafana Labs further indicates that scalable, on-premises logging infrastructure will be an issue of relevance in the foreseeable future. [5,12,20]
The adoption of real-time streaming platforms for logs enables complex event processing (CEP). By analyzing the continuous stream of low-level events with respect to business logic and their chronological occurrence, CEP can extract meaningful information. The context of events is key for this analysis. CEP creates high-level so-called complex events by filtering and aggregating the low-level data stream. Therefore, CEP is well suited to monitor business processes or detect suspicious behavior. [22,23]
Metrics represents the second pillar of observability. Metrics are better suited for persistent storage than logs, hence several time-series databases emerged in the recent past supporting efficient storage and retrieval of metric data. Prometheus as a CNCF project still increases in popularity and will likely establish itself as the standard instrument for metrics. Since Prometheus was deliberately built to be simple, it exhibits deficits concerning long-term storage, replication of data and multi-tenancy. Therefore, tools and managed services appeared lately that are built upon Prometheus to expand its functional range. Cortex can be listed as a prominent example. [13]
With the release of OpenTracing as another CNCF member distributed tracing becomes more accessible for engineers. Previously, the numerous inconsistencies between different vendors created substantial hurdles and thus impaired the broad adoption of tracing. The new standard facilitates the thorough and consistent instrumentation of applications, fosters interoperability between tools and enables the evolution of additional instruments based on the specified API. [29]
DevOps practices
The DevOps philosophy promotes the concept of small, agile and cross-functional teams that completely manage the life cycle of the services they own. This concept requires engineers with a broad spectrum of expertise besides their principal occupation. Suddenly, every team member accounts for platform related aspects such as performance, resilience and security. With the rising complexity of the applications built, observability must be added to the list of requirements for engineers. [1,2]
The history of operating distributed systems taught us, that these cross-cutting aspects must be ingrained into the software from the very beginning. Trying to enhance the observability of an application that was not designed to be observable will likely vanish without considerable merit. Hence, organizations need to adopt an observability-driven development process adding observability requirements to the definition of done for every application. [1,2]
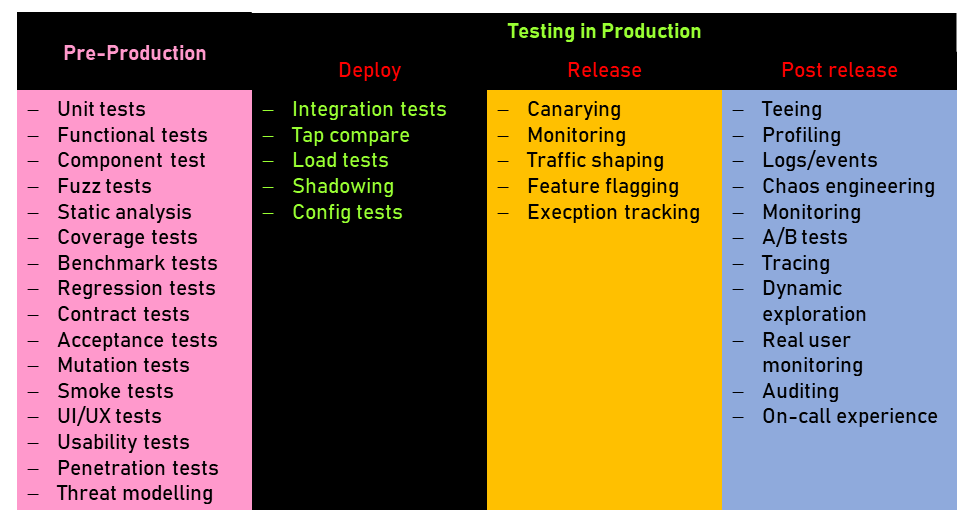
Another core principal of DevOps emphasizes the importance of fast feedback to enable immediate learning. As a result, an organization can enhance its entire velocity. To tighten feedback loops, engineering teams must observe their software in production and analyze data generated by genuine users with real concurrency and unpredictable behaviors. It is imperative for the engineers to understand that they are building systems instead of writing software. Secondly, distributed systems are strongly resistant to being cloned or imitated by a staging environment. Taking the myriad of failure modes into account that can reside in production, merely testing the artifact in a pre-production environment can deceive the confidence in the software. Consequently, the practice of testing software in production has been established in unicorn internet companies. They consider the deployment of software as a process of increasing the confidence in the new code instead of a binary switch between two application versions. Figure 1 depicts the three phases with its manifold aspects of testing software in production next to established pre-production quality assurance mechanisms. Naturally, practices like canary releases, shadow traffic, chaos engineering etc. impose additional complexity and require discipline as well as considerable engineering efforts. [6,30]
The ”you build it, you run it” paradigm ingrained in DevOps entails that every team is in charge of the incident response for their services. The numerous articles, talks and twitter debates about this specific aspect of the application life cycle indicate its importance and topicality. Implementing an effective on-call strategy that does not endanger the engineers’ personal life and health can pose a major challenge. Alert fatigue is a common problem when the monitoring system triggers to many false-positive alerts. The attempt to monitor everything especially the assumed causes of problems will result in frustrated teams. That is why alerting should be based on symptoms impacting the user experience. Despite the dangers a shared on-call rotation enables the engineers to actively experience the ramifications of their software in production. This can raise the awareness of the manifold failure modes and elevate the enthusiasm for resilient systems. [1]
I expect that the relevance of incident response will grow further. For instance, several vendors started working on robust incident management systems such as victorops or pagerduty. Additionally, human factors and the interaction between humans and complex IT systems are more accounted for. John Allspaw is a pioneer in this field and founded adaptive capacity labs to improve incident response strategies in organizations. Acknowledging human factors means that organizations evolve a just culture allowing engineers to derive valuable insights from incidents and failures without the fear of punishment. Continuous learning is an imperative requisite for an organization to control their system with increasing complexity. As stated before, an effective observability system constitutes the foundation for every effort to improve a system.
Another aspect modern observability derives from DevOps concerns collaboration. If different teams use different tools, they impede cooperation and create silos. Employing the same observability tools creates a shared understanding within the organization of the problems which is imperative for effective collaboration. Another challenge lies in the observability tools themselves. They collect, store and visualize high volumes of data but impose the complex task of deriving knowledge from the data on the user. To create new insights, the user must be able to effectively correlate data of different types from many sources. For this reason, several SaaS observability platforms appeared on the market recently, honeycomb or lightstep for example. They provide a software-agnostic interface to ingest all kinds of structured data and offer rich visualization and debugging capabilities to collaboratively inspect systems. Additionally, the use of dashboards for exploration is discouraged, since with dashboards engineering’s jump to answer without asking a question first. [1,24]
I expect that the adoption of such SaaS observability platforms increases across the industry and that they expand their wealth of features. Moreover, they will likely enhance the interoperability with other categories of tools, such incident response or advanced statistical analysis. Maybe they will support the integration of the actual source code so that engineers can analyze logs or traces next to code snippet that emitted the data.
Tyler Treat proposes the idea of an observability pipeline to improve the reliability and flexibility of an organization’s observability system. Inserting a dynamic, scalable intermediary such as Apache Kafka or Amazon Kineses Data Streams, decouples the producer and consumer of observability data. A router at the end of the pipeline sends the incoming data stream to the respective data backend. As a result, this idea prevents the vendor lock-in and allows to easily evaluate and replace tools on the producing or consuming side of the pipeline. Additionally, the pipeline acts as a buffer to protect the backends from overload. [14]
Besides the technical and cultural challenges listed above it is compulsory for every organization to understand the requirements of the teams using the observability tools. The usability of the provided tools is crucial for its adoption within an organization. [20]
More concrete trends
So far, we have established the key driving factors of observability as well as the resulting challenges. Now, we take at look add more concrete trends related to observability that emerged recently.
Technical
To begin with, observability data from edge computing nodes will be integrated to supplement an organization’s understanding of the entire system. With skyrocketing data volumes produced by internet companies and IoT devices the relevance of edge computing as a decentralized processing layer continues to rise. Currently, I’m having a hard time assessing the impact of edge computing on observability. [9]
Observability originates from mathematical control theory. That is why the concepts of “fail fast” and tight feedback loops are deeply ingrained in observability. I assume that the concepts of control theory including its ability to precisely describe systems and infer knowledge will continue to take a key role in evolution of modern observable systems.
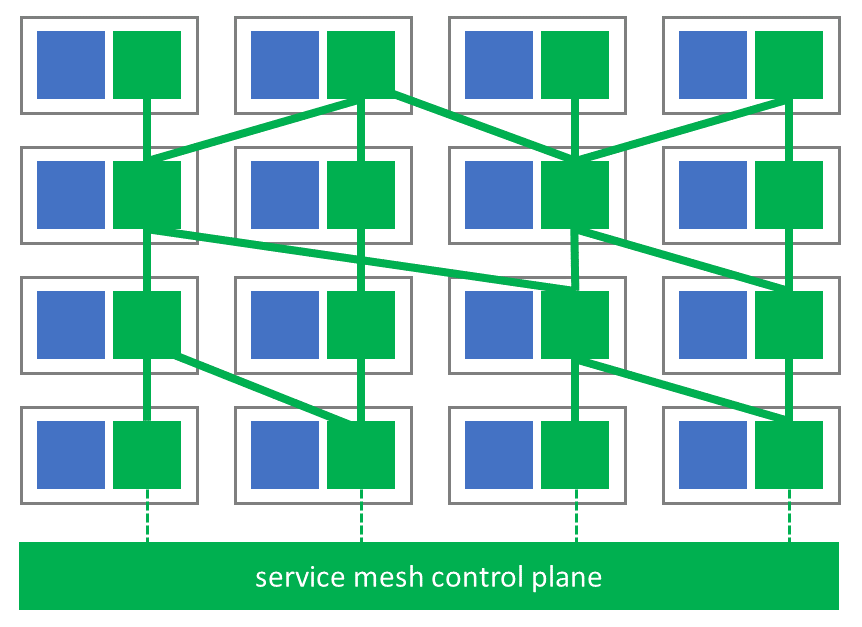
In the world of Microservices the idea of a service mesh surfaced in the last year. One key factor expedites its evolution: the communication within a Microservice architecture increases in complexity. Every Microservice is required to implement additional non-functional features such as circuit breakers, health checks, load shedding, distributed tracing, service discovery etc. distracting developers from the actual business logic. These non-functional requirements concern platform-related aspects such as performance, resilience and of course observability. To successfully operate a service-oriented architecture it is advisable to address platform-related aspects in a uniform fashion across all services. With the “don’t repeat yourself” principle in mind, a service mesh acts as proxy to every service and takes responsibility for inter-service communication as illustrated in Figure 2. The observability of the entire platform benefits greatly from a service mesh because it provides consistent, programming-language agnostic, fine-grained, high-quality data across all services. As we have seen before, standardization allows automation and thereby increases efficiency in multiple dimensions. [10,11]
The evolution of the serverless and FaaS programming paradigm drastically changes the way applications are written, deployed and operated. Hence, the traditional monitoring and observability practices aren’t applicable anymore. Serverless requires a new mindset because servers greatly differ from functions. The access to the underlying infrastructure is limited thus one can’t install a daemon to collect logs or metrics. Besides, the lifecycle of functions is externally managed which can cause loss of information if observability data isn’t send to an outside system eagerly. However, emitting instrumentation data synchronously will increase the latency of functions. To further complicate instrumentation, serverless applications often communicate asynchronously with events which impairs tracing the request flow. In essence, serverless applications hinder engineers to grasp the movement of data and poses another challenge to observability. Many cloud vendors offer dedicated observability tools, but they are tied to vendor, mostly lack maturity and interoperability. Recently, promising observability tools appeared but they are still limited to AWS, e.g. dashbird, iopipe and epsagon. Although the tools are maturing, it seems to me that there is currently no general applicable approach to satisfy observability in serverless environments. [15,16,17]
With increasingly more refined and dynamic client-side applications the pervasive instrumentation must not stop as soon as the requests leaves the backend infrastructure. A sophisticated observability system acknowledges the importance of client-side instrumentation to fully understand the end user experience. Therefore, error and exception tracking, log analysis and considering performance metrics create visibility into the software running on the user agents. Modern browsers offer a several APIs providing a wealth of performance related metrics which can be easily retrieved, e.g. Navigation Timing API.
The first chapter elaborates on the forces leading organizations to build even more dynamic systems with ephemeral components. Consequently, an advanced statistical analysis of the metric data is required to detect anomalies and correlations more reliably. A sophisticated analysis allows the definition of more actionable alerts because simple thresholds cannot account for the dynamic and complexity of modern large-scale systems anymore. Another metric data related pitfall can lie in the implementation of the algorithms. For example, calculating percentile latency at the agent instead of the system level requires an additional form of aggregation which tampers the results and may lead to incorrect conclusions. [20,26]
Intuition engineering
To this point, observability is strictly based on hard facts derived from real data. This continuous to be true but Cindy Sridharan argues that no observability or monitoring tooling can render solid instincts an intuition of engineers dispensable. Observability does not guarantee answers to every question an engineer might ask a system. Casey Rosenthal, Engineering Manager at Netflix, states that the infrastructure of Netflix is beyond the point where one human understands the entire system with all its components. Nonetheless, the engineering teams must assess the health of the system in real-time and quickly detect emerging problems. They want to get a gut feeling whether the system is in a healthy state just by taking a quick glance. Again, the intuition of engineers takes precedence. Rosenthal further elaborates on a key factor to create resilient systems. Teams need to be aware of systemic effects and their consequences. It is imperative to understand that although their software acts correctly in a local environment, scaling the component horizontally causes emergent effects which might entail undesired behavior. [3,18,19]
The challenges of providing quick understanding of complex systems and the estimation of systemic effects of actions drive the emergence of intuition engineering. It is about generating new senses for an environment that are hard to verbalize or explain quantitatively. Assembling a holistic understanding of the system in form of intuition is sometimes more important than concrete data points. The amount of raw observability data engineers are confronted with exceed their cognitive capabilities. Without intuition, they would not be capable of deriving valuable insights from such data volumes. [18,19]
Netflix built Vizercal to visualize the traffic flows within their infrastructure. The speed, size and color of the dots allow engineers to intuitively understand the most relevant information about the traffic with minimal cognitive energy. It facilitates recognizing the normal as well as abnormal behavior in presence of errors. Netflix found that this form of illustration helped engineering teams during incidents to locate problems faster compared to their previous approach with numerous graphs displaying manifold metrics. Netflix provides an example video of a fail-over simulation. [19]
Ward Cunningham’s simulation of web traffic is another example of intuition engineering. It supports engineers to quickly grasp the systemic effects of requests with certain characteristics, e.g. high latency on the server side. By merely looking at tables displaying the slowest requests it would be much harder to identify the cause of resource contention that decelerates other requests. [19,31]
In a similar vein David Shaywitz warns the reader of the unreflecting, over-confident use of data to base decisions on. Being overly exposed to massive volumes of data can deceive our understanding due to the danger of vanishing signal in plenty of noise. We cannot measure everything that is important, hence we must distance ourselves from the intriguing imagination that we can substitute human judgement with pervasive objectivity. To put it short, data is invaluable to derive insights when it’s applied thoughtfully which means that we are aware of its shortcomings and the unmeasured. [25]
Causality and machine learning
Across all industries the application of artificial intelligence begins to replace humans and will further elevate the precedence of IT systems. Naturally, machine learning will revolutionize IT operations and therefore monitoring and observability as well. Gartner released at the end of 2018 their report on the adoption of artificial intelligence in IT operations, coined AIOps. Several tools for the analysis of logs integrate features with primitive machine learning algorithms to detect outliers and patterns. By applying real-time data on models trained with historical information, systems can increase their reliability of predicting future behavior. This allows to take actions more proactively. Furthermore, machine learning powered alerting systems can diminish floods of alerts originating from the same cause to a single, more meaningful alarm. But before intelligent systems can autonomously remedy incidents, they need a better understanding of the problems and the underlying environments. Merely detecting a pattern resulting from a certain kind of failure will not suffice due to the complexity of modern systems. [27]
Albeit employing intelligent algorithms to detect outliers and patterns is certainly a valuable aid, it will not revolutionize observability because these algorithms merely consider the data set instead of the underlying system producing the telemetry. Identifying causal relations is the next step after finding correlated or abnormal data points. A causal dependency is defined as changing one event will affect another event without any further intervention. Grasping the impact of certain actions or patterns creates more transparent and controllable environments. Thus, observability systems can be further enhanced by integrating the concept of causality. [21]
Observability is about understanding the internals of system from an outside perspective. Engineers rely on collectable system signals to assemble a complete and correct model of the system. In traditional monitoring solutions deriving insights is entirely delegated to the engineers. These tools do not include mechanisms to infer a system’s representation from the ingested data. I expect that the next generation of observability tools will be able to connect various kinds of data reaching from application events, metrics and traces to external data and the topology of the entire systems. They will be able to intelligently detect anomalies and correlation as well as potentially expose basic causal dependencies. [21]
As an intermediate step it might be necessary that engineers craft models of casual dependencies manually before machine learning algorithms can derive them autonomously.
Conclusion
Observability uses logs, metrics and traces as building blocks to foster data-driven improvements of the systems we built. Engineers rely on the observability of their increasingly more complex services to truly own them. But the merit of every observability system depends on the business value derived from it. Genuinely understanding an application allows the elevation of the user experience combined with effective and efficient operations without harming the engineers. Transparency is the principal requisite to build resilient systems.
The consequence for a team of truly owning a service means that observability becomes everybody’s responsibility. Instrumentation must be an integral part of software craftsmanship. Moreover, everybody becomes suddenly a distributed systems engineer. This requires additional skills to operate the additional observability tools.
Future observable system are characterized by pervasive instrumentation, high cardinality, events with rich context and structured data. Testing systems in production will become a dominant factor of quality assurance. Observability solutions, especially SaaS offerings, mature to support the new requirements. Consequently, they will be adopted broadly. With intuition engineering we acknowledge the overwhelming complexity of our systems. We are currently deemed to rely on instincts additional to observability until machine learning provides sophisticated solutions to control causality.
Finally, I cannot help but wonder how organization will conduct quality assurance of their observability systems and processes themselves currently and especially in the future. I expected that controlling our observability systems will become prospective challenge.
In short, observability remains a buzzword and it will continue to dominate the way we built and operate future systems.
Disclaimer: I’m not affiliated with any mentioned tool or service provider. All opinions are mine.
Sources:
- https://www.infoq.com/articles/charity-majors-observability-failure (last access: 09.02.2019)
- https://www.honeycomb.io/blog/observability-a-manifesto/ (last access: 09.02.2019)
- https://medium.com/@copyconstruct/monitoring-and-observability-8417d1952e1c (last access: 09.02.2019)
- https://medium.com/@copyconstruct/monitoring-in-the-time-of-cloud-native-c87c7a5bfa3e (last access: 09.02.2019)
- C. Shridharan. Distributed Systems Observability: A guide to building robust systems. 1st. O’Reilly Media, Inc., 2018.
- https://www.slideshare.net/CharityMajors/chaos-engineering-without-observability-is-just-chaos (last access: 09.02.2019)
- https://www.slideshare.net/CharityMajors/observability-for-emerging-infra-what-got-you-here-wont-get-you-there (last access: 09.02.2019)
- https://www.oreilly.com/ideas/7-systems-engineering-and-operations-trends-to-watch-in-2018 (last access: 09.02.2019)
- https://blog.cloudflare.com/logs-from-the-edge/ (last access: 09.02.2019)
- https://medium.com/@copyconstruct/envoy-953c340c2dca (last access: 09.02.2019)
- https://aspenmesh.io/2018/04/observability-or-knowing-what-your-microservices-are-doing/ (last access: 09.02.2019)
- https://grafana.com/blog/2018/12/12/loki-prometheus-inspired-open-source-logging-for-cloud-natives/ (last access: 09.02.2019)
- https://www.cncf.io/blog/2018/12/18/cortex-a-multi-tenant-horizontally-scalable-prometheus-as-a-service/ (last access: 09.02.2019)
- https://bravenewgeek.com/the-observability-pipeline/ (last access: 09.02.2019)
- https://serverless.com/blog/serverless-monitoring-the-good-the-bad-and-the-ugly/ (last access: 09.02.2019)
- https://hackernoon.com/serverless-observability-part-1-new-challenges-to-old-practices-95de1b94d379 (last access: 09.02.2019)
- https://www.infoq.com/presentations/serverless-observability (last access: 09.02.2019)
- https://allegro.tech/2018/04/intuition-engineering-at-allegro-with-phobos.html (last access: 09.02.2019)
- https://www.infoq.com/presentations/netflix-vizceral-intuition-engineering (last access: 09.02.2019)
- https://medium.com/netflix-techblog/lessons-from-building-observability-tools-at-netflix-7cfafed6ab17 (last access: 09.02.2019)
- https://www.moogsoft.com/blog/aiops/observability-beyond-monitoring (last access: 09.02.2019)
- https://www.confluent.io/blog/making-sense-of-stream-processing/ (last access: 09.02.2019)
- https://www.heise.de/ix/artikel/Kontinuierliche-Kontrolle-905334.html (last access: 09.02.2019)
- https://medium.com/lightstephq/three-pillars-with-zero-answers-2a98b36358b8 (last access: 09.02.2019)
- https://www.forbes.com/sites/davidshaywitz/2018/12/24/we-are-not-a-dashboard-contesting-the-tyranny-of-metrics-measurement-and-managerialism/#22964732315b (last access: 09.02.2019)
- https://medium.com/theburningmonk-com/we-can-do-better-than-percentile-latencies-2257d20c3b39 (last access: 09.02.2019)
- https://thenewstack.io/machine-learning-for-operations/ (last access: 09.02.2019)
- https://twitter.com/danielbryantuk/status/1072657587789881344 (last access: 09.02.2019)
- https://medium.com/opentracing/towards-turnkey-distributed-tracing-5f4297d1736 (last access: 09.02.2019)
- https://medium.com/@copyconstruct/testing-in-production-the-safe-way-18ca102d0ef1 (last access: 09.02.2019)
- http://bl.ocks.org/WardCunningham/5861122 (last access: 09.02.2019)
Figures
- Own illustration based on [30]
- Own illustration
Leave a Reply
You must be logged in to post a comment.