
Written by Eva Ngo, Niklas Brocker, Benedikt Reuter and Mario Koch.
In the System Engineering and Management lecture, we had the opportunity to apply presented topics like distributed systems, CI/CD or load testing to a real project or with the help of a real application. In the following article we will share our learnings and experiences around the implementation and usage of Docker, Kubernetes, Rancher, CI/CD, monitoring and load testing.
Since this post is quite long, here is a section overview for your convenience:
The Application
For the project, we used an already existing application. InspireNow is an app developed by a startup with the vision to uncover the hidden potential and knowledge of companies and organizations. Based on their skills and interests people are brought together for neural rendezvous. They can share their knowledge and therefore enrich and educate each other.
InspireNow consists of an app that enables people to exchange and meet. In addition, there is a backend with an admin interface (also called admin dashboard) and an API with which both the app and the admin interface communicate with.
So far, the production and development environments were deployed on Heroku. Those deployments were updated as changes were made using the Heroku integrated CI/CD pipeline. Heroku is a platform-as-a-service provider that makes hosting a project very easy. Heroku takes care of the usual building blocks, such as load balancing, embedding of environment variables, SSL certification and DNS routing. Therefore Heroku is ideal for innovating quickly and focussing on building up the product itself. However, Heroku is relatively expensive to scale and lacks possibilities for granular or individual adjustments.
In addition to the existing deployments on Heroku, a Prometheus instance was hosted on Heroku to enable monitoring in combination with Grafana. The database – a MongoDB replica set – was already running on Hetzner Cloud. A replica set is a type of distributed database that guarantees redundancy and high availability among other things. The setup of the database will not change throughout this project and is not part of the scope.
The overall goal in this project is to migrate the InspireNow backend (API + admin interface) which is currently hosted on Heroku to the Hetzner Cloud on bare-metal servers.
Goals
What do we hope to achieve? InspireNow expects to acquire new customers in the near future. In order to cover an employee and user amount in the range of 50,000 to 100,000, the application must scale to guarantee better performance and availability. Because of the B2B-model, even one large new customer could mean an immediate increase of 50,000 users in one swoop. Therefore it is essential to be able to adapt the application specifically and effortlessly to these new circumstances. As mentioned in the section above: scaling at Heroku is expensive and somewhat throttled. Multiple Heroku Dynos run on the same EC2 instances (on AWS) under separate namespaces (containers). As applications grow and build up serious traffic, this can cause significant performance issues. Additionally, Heroku is a black box. As a consumer, you do not know exactly what Heroku is doing in the background. In the long run, all those drawbacks were not desirable for InspireNow, since, aside from scaling and cost minimization, better flexibility and individual configuration options are also needed.
Here is an overview of our goals:
- better scaling and therefore future viability
- cost minimization
- more configuration options and control
- increased performance
In the end, we will perform load tests on both the old and the new environment. The results of the load tests, which can be obtained by implementing appropriate monitoring, will be compared and evaluated to help answer the question of whether the mentioned goals were achieved.
Besides the already mentioned superior goals, all other features that were previously offered on Heroku should of course still work in the new setup after the migration. In summary there are:
- CI/CD pipeline
- SSL certification
- DNS routing
- embedding of environment variables
Additionally, the already existing monitoring solution with Prometheus and Grafana has to be updated for the new, distributed and containerized architecture. Metrics, so far provided by Heroku, have to be added and covered by the new monitoring solution as well.
Approach
In this chapter we will describe our approach in order to achieve the previously mentioned goals, including the according tools that we chose for this purpose. We explain the steps taken without diving too deep into technical details. If you crave for more information about the technologies themselves, we have linked the documentation of the individual tools for further exploration. The overview of our steps is the following:
- Containerize the backend with Docker
- Create Kubernetes clusters with Rancher
- Build CI/CD Pipeline with Github Actions
- Set up central monitoring with Prometheus and Grafana
- Use the monitoring for evaluating the overall implementation with load tests created with Artillery
Docker
The first step is to containerize the backend. It is the foundation to all future steps. There are a few technology options:
- Docker: Docker is still the most widely used technology in this area. However, that does not mean it is always the right solution. That is why we took a closer look at two other options.
- rkt (Rocket): rkt is one of the biggest alternatives to Docker. However, development was discontinued in 2020. Therefore, this technology was not an alternative for us.
- Mesos: Mesos is also widely used. However, Mesos seems to specialize in larger applications. This is not the case here. Some examples: it is used by Netflix, Airbnb and Twitter.
As you can already conclude from the section title – we decided to use Docker. Therefore the backend had to be dockerized.
Docker was able to improve the local development of the project. Previously, several steps had to be followed to get the backend up and running. With Docker this setup is much easier. It would have been possible to split the admin dashboard (the frontend of the backend) and the API into individual Docker containers. However, this would have added unnecessary cost and complexity to hosting which did not fit into the scope of this project. Therefore we decided to use a single container for the entire backend.
Additionally, it was possible to set up the entire infrastructure locally with Docker Compose. In older versions, it was required to connect to the actual develop database to get reasonable results. With the new setup, it is possible to use a local MongoDB replica set.
We could now use the created container for the next steps in our setup. We initially pushed the image to Docker Hub. However, after some research and reflection, we ended up switching to Google Container Registry. Since the application already uses some features of Google Cloud it is easier to add an additional service here, instead of adding an entirely new dependency via Docker Hub.
Rancher & Kubernetes
The previous step of dockerizing the application set the foundation for Kubernetes. We have mentioned that we want to achieve better scalability, performance and availability. Since Kubernetes is the standard technology for this purpose and is widely used, we decided to implement a Kubernetes infrastructure for our project.
With a bit of research, we found the tool Rancher which allows the Kubernetes installation and management on bare-metal servers on Hetzner. Rancher is an open-source platform for container orchestration and cluster management and comes with a clean user interface which makes configuring Kubernetes clusters much easier than dealing with various YAML files. With Rancher, we can realize all the required features that Heroku has managed for our application up to now. We can create our environment variables and set them per project/namespace as Kubernetes secrets. Moreover, it is possible to obtain an SSL certificate from Let’s Encrypt with the Kubernetes controller Cert-Manager which also handles the automatic certificate renewal and link it in Rancher with our application. Furthermore, Rancher supports several DevOps tools. That means we can easily integrate our CI/CD pipeline as well as plug-in common tools for logging and monitoring. Another reason for our decision for Rancher was the Hetzner Node Driver which enables the automatic provisioning of Hetzner servers through Rancher. Therefore you can simply scale horizontally with one click and Rancher automatically orders a new server on Hetzner and configures it accordingly so it is added to the Kubernetes cluster.
We decided to install Rancher in a HA-mode (high-availability) which means Rancher is running on its own cluster with three master nodes. The installation was very easy and could be done with a few steps because we used a RKE (Rancher Kubernetes Engine) cluster which is a lightweight and very fast Kubernetes distribution that runs entirely in docker containers.
Once the Rancher setup was done, we could set up the connection between Rancher and Hetzner. For that, we need to add the Hetzner Cloud Controller Manager to the configuration of each cluster as well as install the previously mentioned Hetzner Node Driver globally through the Rancher GUI. This enables Rancher to communicate with our Hetzner project and allows more automation features, e.g. the automatic provisioning of Hetzner servers by Rancher. Especially the node templates are worth mentioning here, as they provide an opportunity to create templates for servers in which you can define configurations like operating system, hardware components, region, server labels and more. It is even possible to specify something similar to a script that will be executed during server initialization. In our case, this was used to configure firewall rules. This node template can then in return be used as a blueprint for the node pools of a cluster. When scaling horizontally – either by clicking the plus-button in the GUI or by editing the corresponding YAML –, the specified node template will be applied for server provisioning on Hetzner.
When the prerequisites were done, we could start creating the clusters for the application with the help of the node templates. We decided to create a production and a development cluster separately.
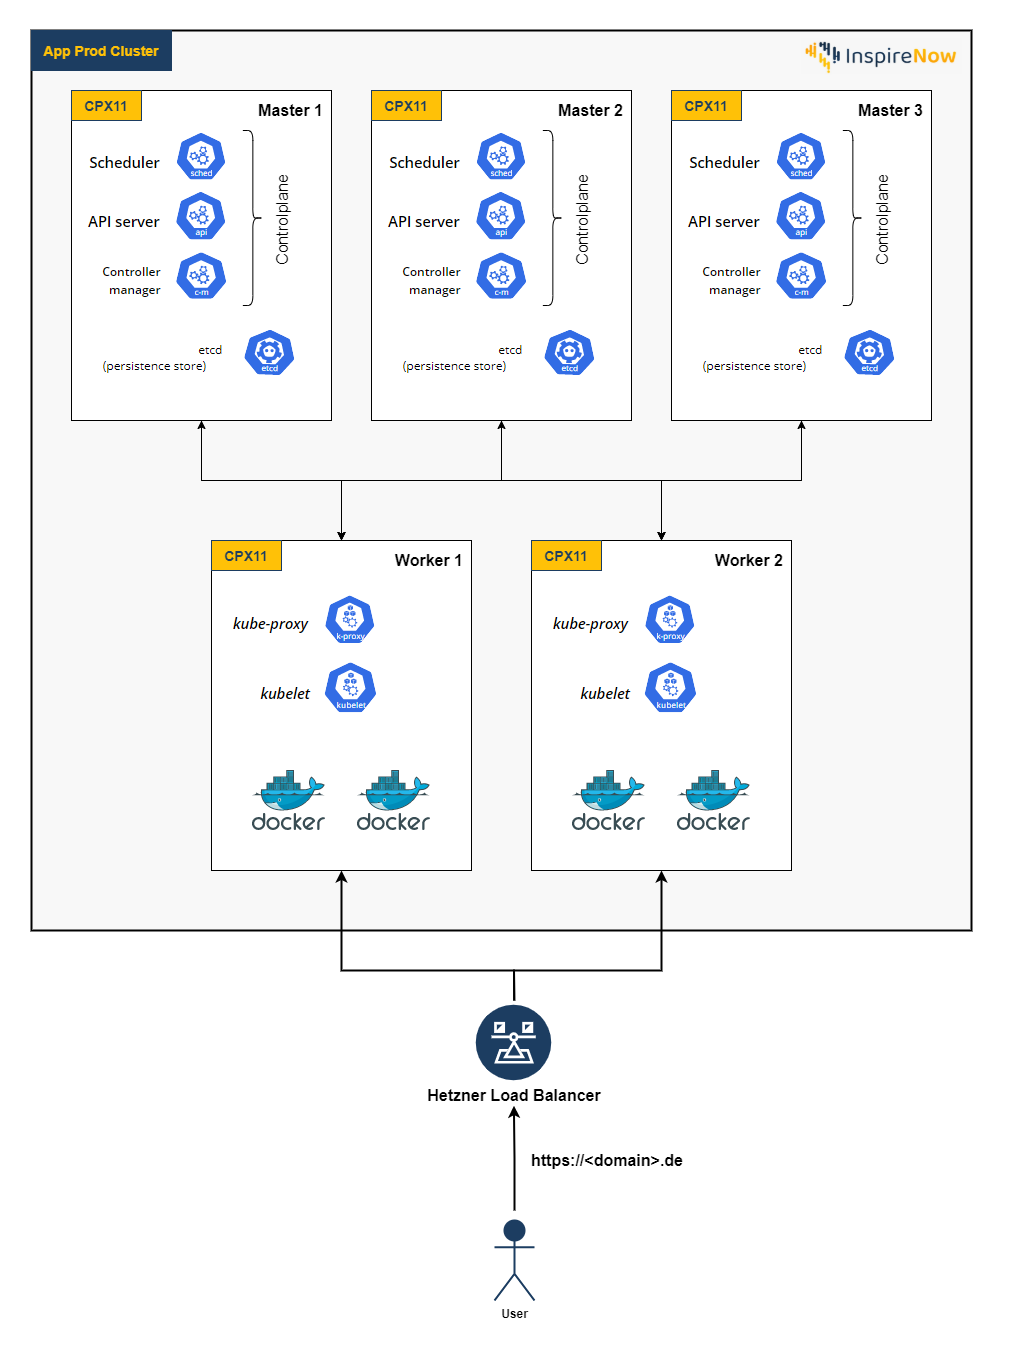
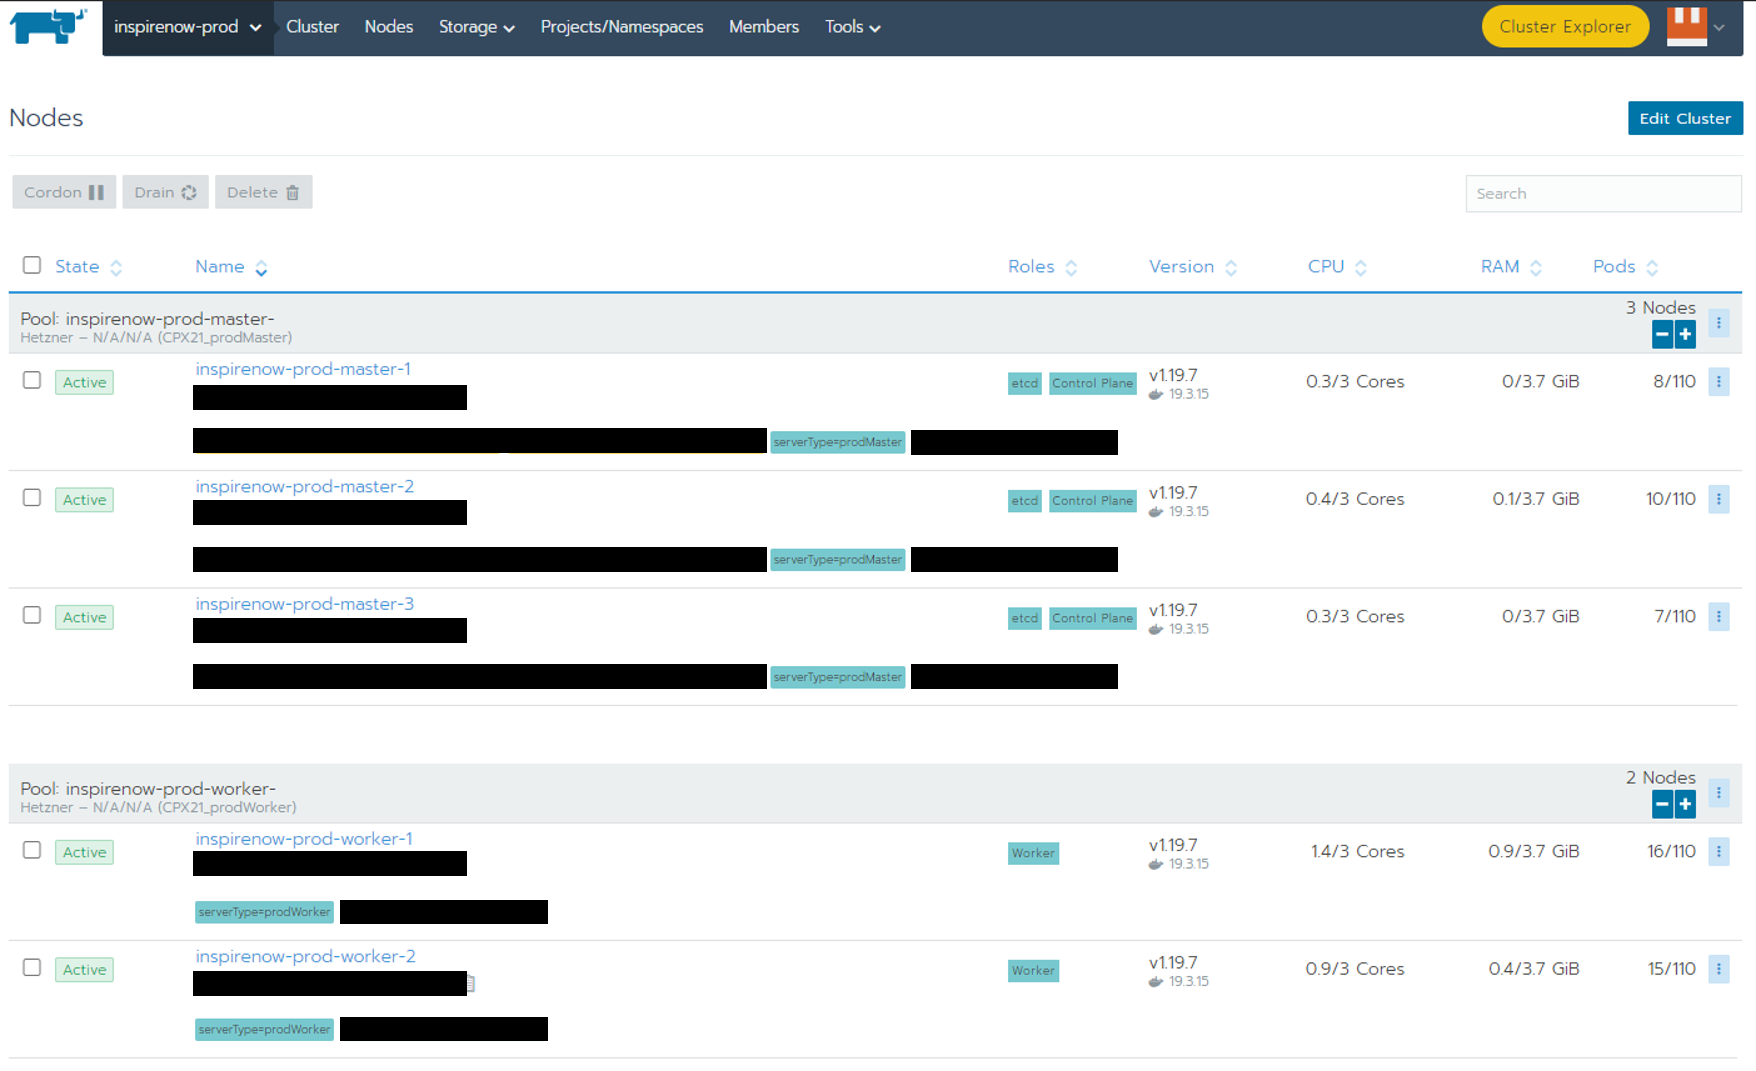
The production cluster consists of three master and two worker nodes, each with two pods. Through Rancher, we could easily create the necessary workload/deployment for our application, pull the image we had previously pushed to the Google Cloud Registry, set the desired scaling of four pods in total and select the environment variables. To expose the application Rancher even automatically created an according service for the workload. The last step was to configure an ingress to make the application publicly available under the desired domain. The ingress is the starting point to access the app in the cluster and that is also where we added our SSL certificate. Additionally, we have rented an external load balancer on Hetzner and configured the worker nodes to be set as targets, so that the load balancer can distribute the load between our two workers. The described architecture of the production cluster can be seen in the figure below. We have intentionally chosen the CPX11 server instances since they comply with the suggested minimum requirements and should therefore suffice for our trial phase.
For the development cluster, we have only set up one master and one worker node which also means that we do not need an external load balancer. It is intentionally kept simpler to save costs because performance and availability were not relevant in this context and this point of the project yet. However, there is always the possibility to scale vertically or horizontally when needed. For example, when we want to run load tests on the development cluster, we would need a similar setup to the production cluster to achieve realistic results and could easily add more worker nodes and an external load balancer.
On the image below you can see a part of the Rancher interface which shows that scaling is as easy as one click on the plus button.
GitHub Actions
In Heroku, the implementation of CI/CD was relatively simple. You link a GitHub repository that Heroku will use to get the source code of the application. To map these functionalities in the new environment, we used GitHub Actions.
With GitHub Actions, you can easily create workflows that can perform various tasks just like in a classic CI/CD pipeline. To do this, you create YAML files in the corresponding GitHub repository which define the procedure as well as the configuration of the workflow.
Within the workflow, the actual “Actions” are used. They represent predefined implementations of operations that can be customized with specific parameters. The actions are mainly written by the community, but larger companies such as Docker or GitHub themselves also provide them. An example of this is an action, published by Docker, which builds a Docker image and then pushes it to a defined registry. You can find all published Actions in the GitHub Marketplace.
In public repositories, GitHub Actions can be used completely for free. In a private repository, you have 2,000 (GitHub Free) or 3,000 (GitHub Pro) free minutes per month. In other words, you could run a build with a duration of ten minutes either 200 or 300 times per month. Currently it is very unlikely to reach that limit within this project. However, it is possible to host the runner yourself at a later time. With a self-deployed runner, there are no limitations regarding build time. Another advantage of GitHub Actions is that it is tightly integrated into the GitHub structure, so workflows can flexibly respond to GitHub events such as pushes or pull requests.
Travis CI and Jenkins were discussed as alternatives. We were quickly able to discard Travis CI because of its costs. Jenkins is completely free, but you have to host it yourself, which leads to higher maintenance costs. On the other hand, it is more independent. Managing multiple projects with Jenkins at the same time is much easier. However, since the repository of the project is already on Github and we only have one repository, we also decided against Jenkins.
For our project, we have implemented three GitHub Actions workflows:
The first of our three workflows responds to every push in any branch. The tool Prettier is executed, which ensures a consistent code style.
Secondly, in our repository, there are two permanently existing branches: master and develop. The goal is that these branches may only be extended with the use of pull requests. To ensure that only working code is added to these branches, a build workflow is started for every pull request and every push into a pull request. This workflow checks whether the project can still be built with the new changes.
The third and final workflow is triggered when code is pushed to the develop or master branch. Here, a Docker image of the application is built and pushed to the Google Container Registry. The name of the image is adjusted depending on which branch the push occurred in. Additionally, the image is tagged with “latest” and a string that can clearly identify the current commit. This way you can trace every created image back to a specific commit.
Finally, a redeploy to the corresponding Kubernetes cluster is performed via Rancher. The selection of the correct cluster is again dependent on the used branch. This means that the Kubernetes cluster associated with the branch is redeployed with the new image.
Monitoring
The goal of our project was to improve the scalability and future viability of the application. In principle, this has been achieved by using the components and tools described so far.
There is only one problem: we have built a black box. We can determine whether the application is accessible in general or not, but beyond that, we lack any insight into the system and its performance.
For example, the following questions – among others – cannot be answered:
- How does the system behave under load?
- What load can it withstand at all? Where are the load limits?
- Are there any peak periods? If so, when are these peak periods? What is the performance of the system at such peak times?
- Which APIs have the longest response time and which have the shortest?
- Which APIs are requested the most often, which the least often?
Monitoring can be used to answer precisely these and other questions. In short, transparency about the system in place can be obtained.
As already mentioned, a monitoring solution was already implemented in the previous setup using Prometheus and Grafana. However, this has become useless due to the switch to a distributed architecture with containers. Traditional monitoring tools are usually based on static configuration files and are designed to monitor machines or individual monoliths, not microservices or containers. In the world of containers, things change quickly. Containers are constantly being created and destroyed, which is why special service discovery functions are essential to ensure smooth operation.
Heroku offers metrics based on the four Golden Signals – errors, saturation, latency and traffic. Events (errors), memory usage and dyno load (saturation), response time (latency) and throughput (traffic) can be accessed in the Heroku Dashboard.
By shifting from Heroku to the self-managed Kubernetes infrastructure on Hetzner, these metrics naturally disappear. The four Golden Signals were established by the Google SRE (Site Reliability Engineering) team as a guideline and recommendation and are very informative and provide a good insight into the actual state and performance of the application. Accordingly, we used these Golden Signals as a guide to set up a new monitoring solution. Since using Prometheus and Grafana adds additional overhead and therefore load, the CPX11 instances used for the minimum setup were not sufficient anymore. We chose CPX21 instances as they present a great compromise between cost and performance. Node Exporter is used to extract information about the saturation. This allows us to answer the question of how full or how busy the system is. As a rule, the performance of a system already drops sharply when saturation of > 80 % is reached (e.g. over 80 % CPU utilization). This limit should be kept in mind.
In the context of our NodeJS application, we used prom-client in combination with express-prom-bundle to cover the remaining Golden Signals errors, traffic and latency.
Errors describe the number of failed requests. Either explicitly – e.g. there is a 500 status code –, implicitly – the status code is 200, but there is an error in the message body – , or by policy – if it is defined that every request over one second is considered an error. In a classic web application, traffic is the number of requests that can be processed per minute or per second. Latency describes the time needed to process a request. It is important to note here that you should work with histogram metrics, as a median is not very meaningful. For example, if there are ten fast requests and one very slow one, the median would probably still be in a good range. The one very slow request would get lost in this measurement. This must not happen, because a single slow request can potentially be a bottleneck for all the requests that depend on it. Slow requests are generally very annoying and undesirable for a user.
The relationship between the individual metrics (signals) is shown below using an excerpt from the monitoring system.
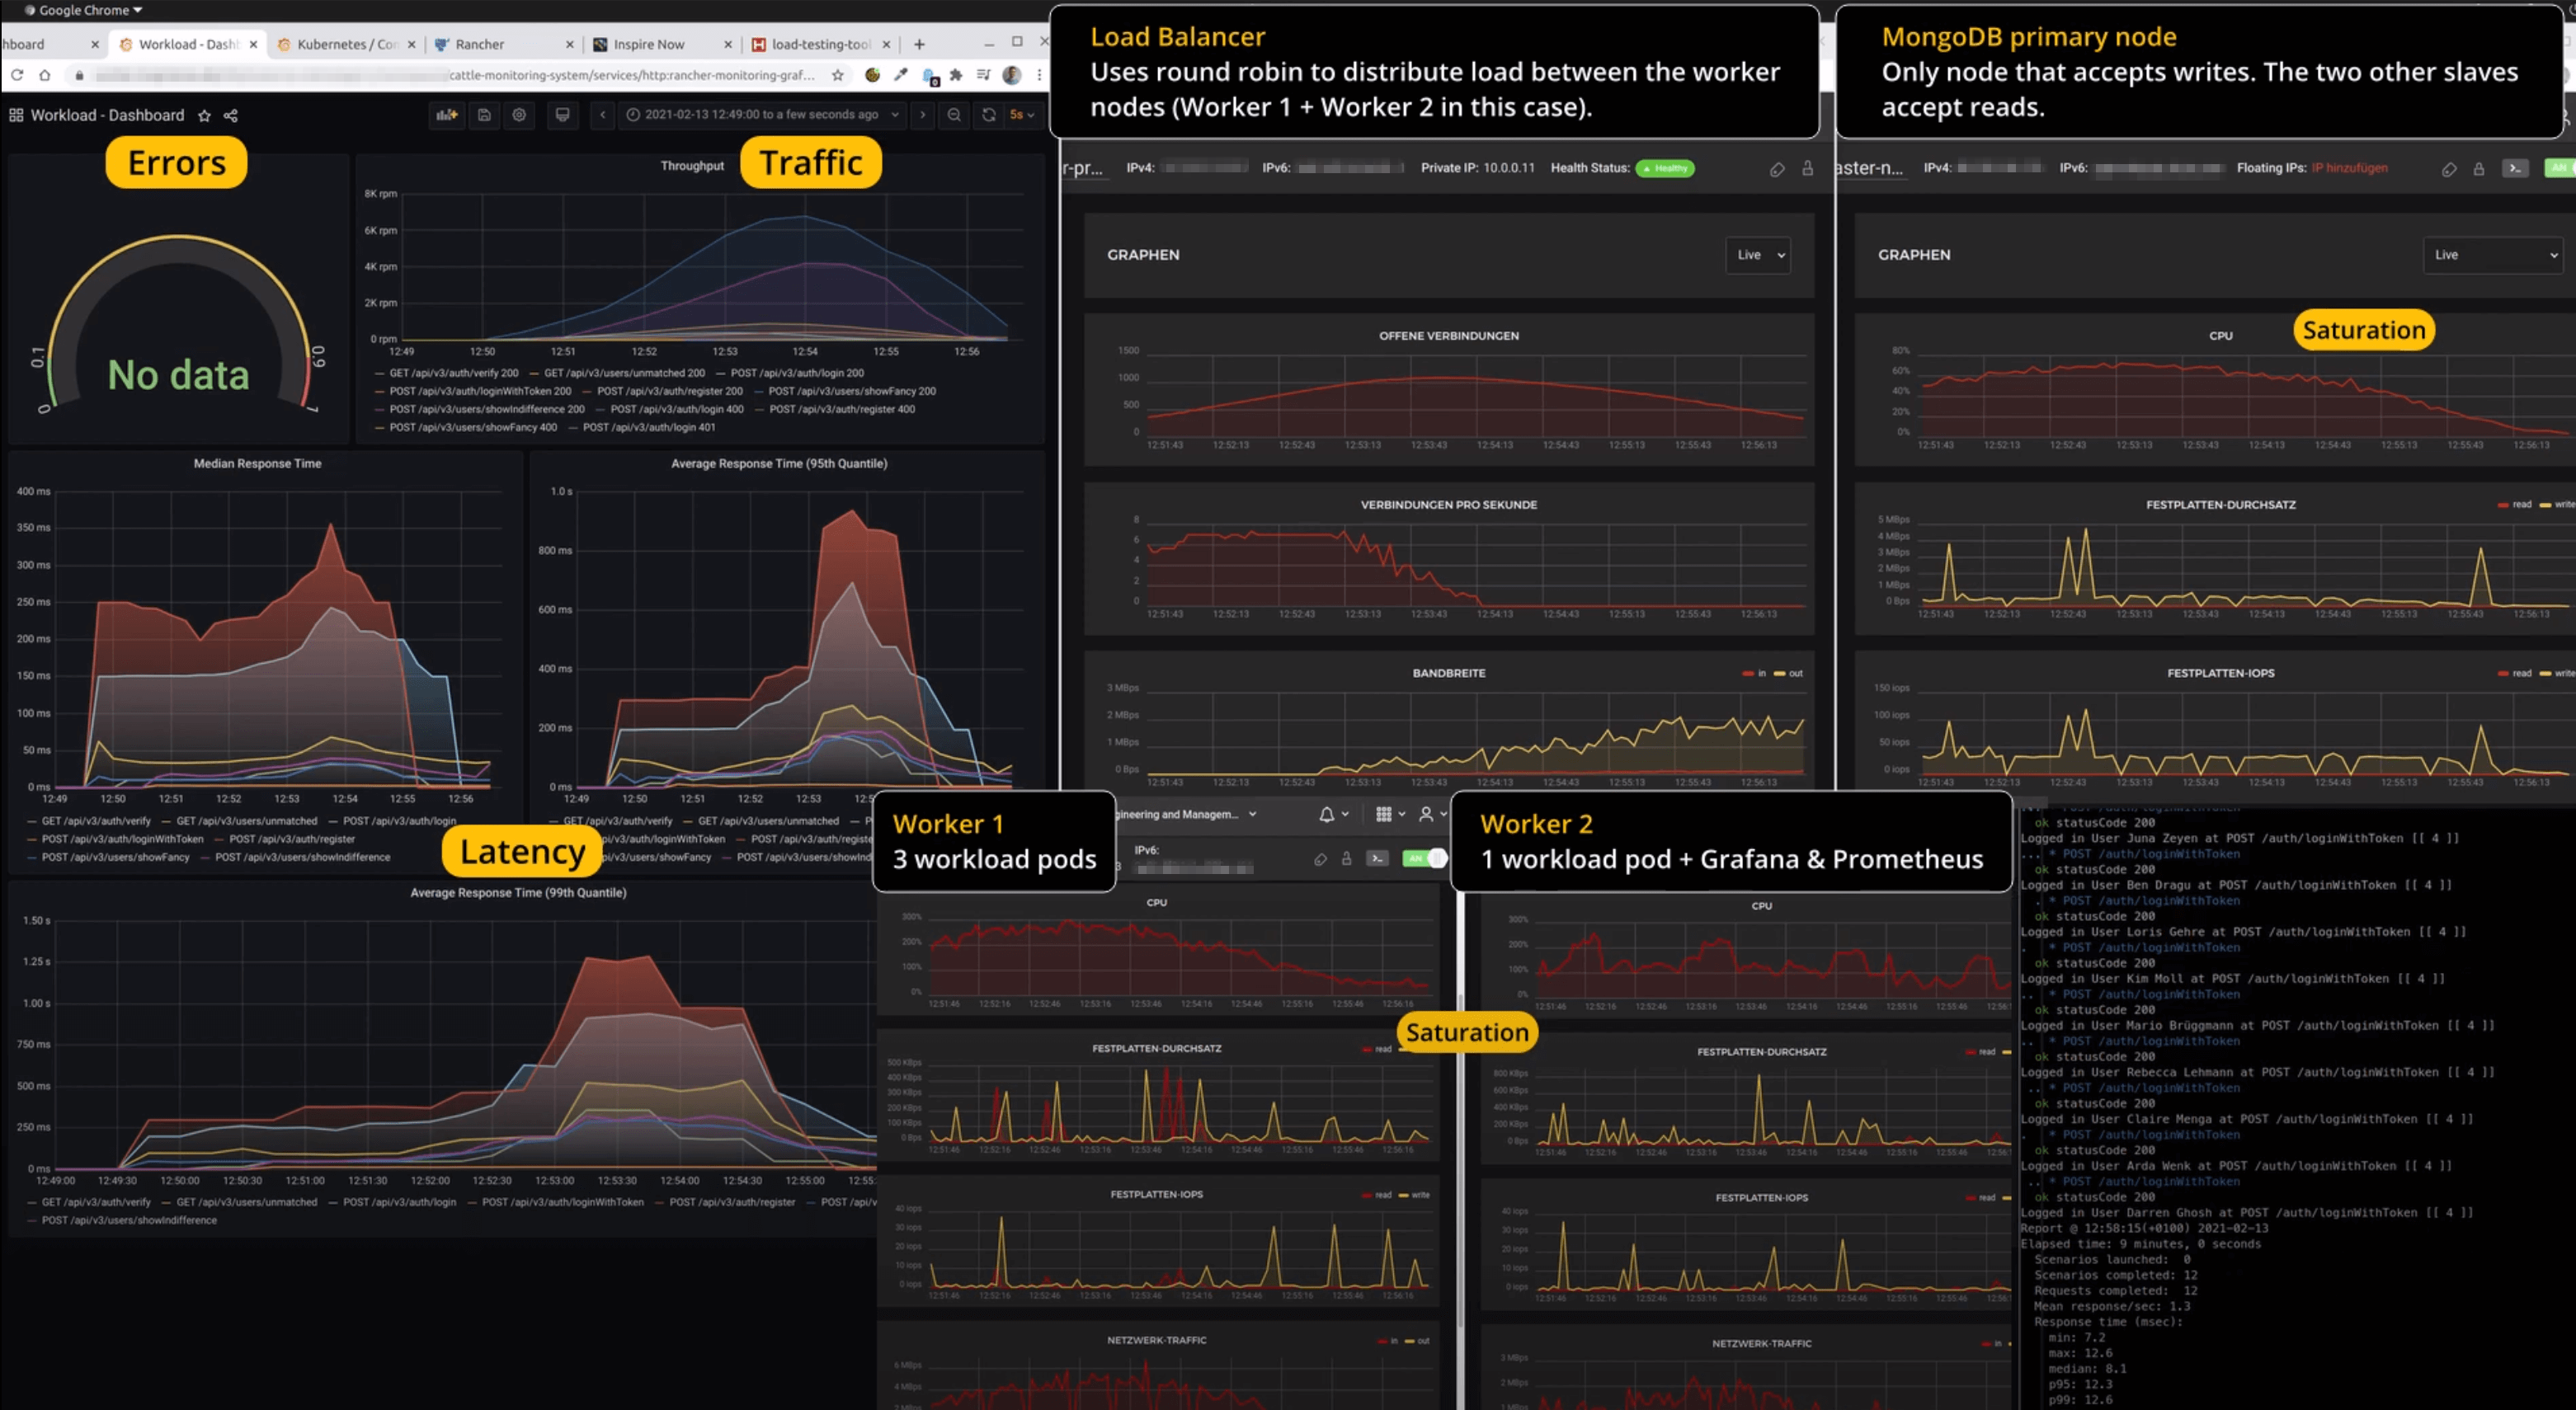
A Grafana dashboard can be seen in the left area. It reveals insight about errors, traffic and latency. For this example, the saturation is read from the graphs of the Hetzner instances themselves. However, CPU utilization could just as easily be visualized via Grafana through the metrics collected by the Node Exporter.
In the period between 12:52 and 12:55, the load in the system was the highest. We can see that the traffic peaks at about 13,200 requests/min or about 220 requests/s in total. At this time, the load balancer holds a total of roughly 1,100 concurrent connections.
The clearly visible increase in latency during this period is due to the fact that saturation in the system – at least for one component – has almost been reached. More specifically, the CPU of Worker 1, which was running three of the total four workload pods, reached full utilization. We can see in the graph that the CPU utilization even reaches 300 % for a short period of time (300 % because the worker has three vCPUs and the workloads are stacked → 100 % * 3). The primary node of the database replica set also briefly reaches a CPU utilization of 75-80 %, but should not have been the bottleneck in this case.
In summary, the following can be concluded:
- The load balancer should easily be able to hold 10,000 connections simultaneously. The maximum value of 1,100 achieved is therefore still far from the possible saturation.
- The primary node of the DB Replica Set is close to its saturation with just under 80 %. Accordingly, it may make sense to scale this instance vertically if the load is expected to increase.
- Worker 1 has reached full saturation. It was the bottleneck of the application and led to the observed increase in latency.
- Worker 2 has short-term spikes, but is on average only at ~ 50 % of its possible utilization.
- In order to mitigate the increase in latency with a comparable load, it therefore makes sense to better distribute the load of the workload in the first step. The following options are available for this:
- Vertical scaling of Worker 1
- Even distribution of the workloads pods on the two existing worker instances → two pods on Worker 1, two pods on Worker 2
- Horizontal scaling of the worker instances themselves, thereby achieving a more even distribution of workload pods
- Potentially, it may also make sense to scale the worker instances vertically as well as the workload pods horizontally
→ e.g. assign double resources (six instead of three vCPUs) to the worker instances and increase the number of workload pods from four to ten.
Good monitoring with carefully selected metrics can therefore be extremely helpful in gaining an understanding of the underlying system and its performance. It is possible to take a kind of bird’s eye view and draw conclusions for the individual components and their function by analyzing the different metrics.
Load Testing
Load testing is essential to check the reliability and stability of an application. Since the main goal of this project was to make the application more scalable and also future-proof, it was clear to us that we need to perform load tests to check which traffic and load the application can withstand. Load testing enables a proactive approach to scaling the application. Bottlenecks can be detected before they occur and cause damage or downtime.
It was important for us that it is possible to represent complex and realistic user scenarios and flows. Since this is easily possible in Artillery and can also be combined with scripting or, for example, data from Faker, we decided to use this tool. The possibility to use Artillery for Continuous Performance Testing and to integrate it into the CI/CD pipeline to prevent the deployment of performance degradation to production was also an attractive aspect. A notable alternative to Artillery would have been k6.
The configuration of the load test is done in the form of a YAML file. The test itself can be divided into different phases, e.g. warm-up phase, persistent load, peak load and a cool-down phase to wrap up the test. It is also possible – depending on the environment (production, development, …) – to specify a different target, i.e. a different IP or host. Since a realistic simulation of the load was important to us, we created two types of users and corresponding flows. Using Faker, 2,000 “new” users were generated before the load test and stored in a local CSV file. During the load test, these users go through the “Register, Verify, and Login” flow (hereafter referred to as Flow A). To simulate existing users and the actual use of the app, an additional 3,000 users were created in the database before the start of the test. These existing users then undergo the “Swipe & Match” flow (hereafter referred to as Flow B) during the test. In this flow each virtual user first logs in and then retrieves his or her current SwipeDeck, which is calculated (by the matching algorithm) based on the specified interests and skills and the other existing users. From this SwipeDeck, the virtual user then swipes ~ 45 times to the left or right to indicate interest or disinterest.
Using weights assigned to the individual flows, we have determined that ~ 17 % of the virtual users should run through Flow A and the remaining 83 % through Flow B.
The fact that the load test runs over a total period of about ten minutes also ensures that newly registered users from Flow A can eventually appear in the SwipeDeck of users from Flow B, provided that the matching algorithm calculates a suitable match.
With the help of the load tests, we were able to find out where the load limits and potential bottlenecks of our application are. A partial result of this has already been described in the section about monitoring. In a nutshell, the limits of the current infrastructure are at around 1,100 concurrent users and 220 requests/s – at least with the simulated load of the user flows described above. In this order of magnitude, saturation occurs at the worker nodes, which in turn leads to performance losses and thus an increase in latency. If a load above these reference values is expected on a regular basis, it is advisable to optimize the scaling of the worker nodes or the workload first. The next component that should reach saturation and thus be optimized is the database, more precisely the primary node of the replica set. Here, a simple vertical scaling of the instance should already be sufficient (see section monitoring).
An intriguing phenomenon that occurred during load testing is described in the section “Load testing – identifying the actual bottleneck”.
Challenges
Since all the topics were quite new for us and we all did not have any experience with the tools, the implementation did not go smoothly and we stumbled across some challenges. In general, we had to do a lot of research to get a profound understanding of the complex topics and their correlation. It was difficult to find the right path to the solution and we had to gather information from various sources and put our solution together piece by piece. A lot of times we also just tried things out and it ended up in a “trial-and-error”-like procedure.
In the following parts, we will describe some of the problems we experienced in our implementation, in hope that they might help you when you come across a similar problem.
Cluster Creation with Rancher
When Rancher was set up, we started to create our first clusters through the Rancher GUI. Creating the cluster through Rancher is very easy and can be done with a few clicks. However an error occurred during the cluster creation process. It did not occur every time, but in most of the cases. Apparently the cluster health check failed and therefore the cluster could not be created. We did not know how to solve this issue, because we could not even look into the cluster or the logs, because technically the cluster was not even created yet. So we started to analyze if anyone else has experienced this with Rancher before and surprisingly a lot of people have. Going through the issues and solutions of other developers, we found out that the cluster health check logic was changed in the new 2.5 Rancher version. Apparently this does not work well if a node does not have the worker role during the cluster creation process. This explanation made sense to us and confirmed our observations, because we had discovered that the error never occured when we tried to create a single-node-cluster with one node which had all the roles. We evaluated this solution and confirmed that the cluster creation only worked after initially adding nodes with all roles. After the cluster was created, we removed the worker role from our master nodes and added worker nodes separately. This solution or rather workaround has worked for us but is pretty inconvenient and unnecessary effort. We hope that Rancher will fix the behaviour of the cluster health check in future versions to not restrict cluster creation to the existence of a worker.
Network & Firewall Configuration
Another problem that we had was within the network. The website load time of the deployed cluster was sometimes extraordinarily slow, sometimes even resulting in timeouts. After some research, we were able to discover blocked packages from the master nodes to the worker nodes in the firewall logs. Our first thought was that there was a problem within the firewall or the rules of the firewall.
All our machines were supposed to communicate over a private network. Any incoming network traffic to the public IP address that was not explicitly allowed should be blocked. By analyzing the firewall logs, we were able to limit the blocked packages very precisely: The master nodes did not send certain packages via the private network, but via the public network. This resulted in the destination system blocking these packages.

Ultimately, we were able to find the root of the problem in a deeply buried log file within a Kubernetes pod. We could see that the container selected the wrong network adapter as the default one.
The network configuration of the containers within the Kubernetes cluster is handled by the tool Canal. The name of the default network adapter was defined in the configuration of Canal. Since the master nodes in the cluster had a different instance type, the name of the network adapter was also a different one there. We were able to solve the problem by setting up the same cluster with the same instance types across the cluster.
If you want to work with different instance types in the future, you could also rename the corresponding network adapter in the node templates of the different instances.
Load Testing – Identifying the Actual Bottleneck
In the course of load testing and trying to figure out the load limits of the application, we encountered an interesting phenomenon. The results displayed by Artillery after a completed test seemed to be always more or less the same. No matter what we adjusted on the actual infrastructure and resources of the application, the results did not change. We scaled the instances themselves horizontally and vertically, used a more powerful database cluster, and also scaled the workload horizontally, i.e. the number of workload pods. None of this had any effect whatsoever on the results displayed locally by Artillery. This did not seem right at all.

After all, it surely was not possible that instances which are four times as expensive and deliver five to six times the performance would leave the load test result itself completely unaffected. Something seemed to be going wrong.
Luckily we already had a comprehensive monitoring system in place at this point that we could use to get closer to identify and solve the problem. We monitored the CPU utilization of the individual instances (workers and database) during the load tests. No abnormalities – the utilization was still far from saturation. The load balancer showed 1,100 open connections in the peak state, but can hold up to 10,000 connections in total. Therefore this should also be far from its limit. What made us really suspicious was that the latency, i.e. the response times tracked within our application itself, differed significantly from those reported locally by Artillery. The application-internal monitoring with Prometheus and Grafana showed us response times in the range of 300-400 ms with occasional outliers of 1-2 s. In contrast, Artillery reported maximum response times of up to 60 s and the p99-quantile was at shocking 6 s. Because we had all these findings and ultimately full transparency about what was going on inside our infrastructure, we came to the conclusion that the real bottleneck must be outside. We knew from our internal monitoring that the requests would be answered by the workload pods after 300-400 ms at the latest, including database access. Therefore for us the most obvious hypothesis was that our own network has to be the bottleneck, i.e. the network over which the load test was executed.
We were then able to confirm this hypothesis by renting another instance on Hetzner and running the load tests from there. Suddenly the load test results made sense and behaved exactly as expected. Finally, we were able to confirm that horizontal or vertical scaling increases the load limits of the application.
This phenomenon shows that load tests and monitoring actually go hand in hand. Only if meaningful monitoring is available, worthwhile conclusions can be drawn from the load tests themselves.
Debugging within Distributed Systems
When working with distributed systems, a lot of things have to change compared to working with monoliths. We have already heard of one example in the Monitoring section. The setup has to be adapted and there were some aspects we had not considered. One aspect is debugging which also changes when migrating to a distributed architecture. We have various locations where errors can occur now and without a central logging solution debugging is a lot harder than before. When we had problems, we therefore had to manually look into the individual logs of the different components to find the cause of the error. This took us a lot of time and effort which could have been saved by settings up central logging right from the beginning.
Evaluation
We were able to achieve all goals that were defined in the Goals chapter.
With Kubernetes and Hetzner we are able to easily scale vertically and horizontally, ensuring scalability and future viability. Since we manage the Kubernetes cluster via Rancher, we now have an enormous amount of configuration options and therefore more flexibility and control. The environment variables can be set in Rancher. In addition, the SSL certification is embedded in the Kubernetes cluster and Cert Manager automatically renews the certificate from Let’s Encrypt.
We were not able to directly reduce the current costs. However, we were able to significantly increase the performance at the same cost. Furthermore, scaling is way more efficient and the associated cost is greatly reduced.
With Github Actions, we were able to implement a CI/CD pipeline that also differs between production and development environments.
By using Prometheus and Grafana, transparency and understanding about the new architecture is achieved. Although Heroku provides a coarse overview of the four Golden Signals, these are only of limited informative value, because the functionality and customizability is severely limited. For example, two hours is the smallest time window that can be selected. With the now cluster-internal monitoring setup, metrics can be analyzed down to a granularity of seconds. Additionally, a drill-down approach can be used to obtain specific metrics of individual nodes, namespaces, or pods.
The final load tests, which are described in the following section in more detail, also confirm the success of the new setup. Despite the same cost and same load, the new setup is significantly more stable and has a better performance.
Performance (and Cost) Comparison – Heroku vs. Hetzner
Using the reference load test, which was already described in the section load testing, we finally compared the previous infrastructure on Heroku with the new architecture on Hetzner which was implemented during this project.
To create a point of comparison, we looked at the cost. On Heroku, one dyno of type “Standard-1X” costs about 20.60 €. A dyno of the type “Standard-2X” costs the equivalent of about 41.30 €.
Our new architecture on Hetzner can be divided into two parts.
- Rancher high-availability (HA) cluster
3x CX 21 instances = 3 x 5.83 € = 17.49 €
- Production cluster (actual workload)
5x CPX 21 instances = 5 x 8.21 € = 41.05 €
1x LB 11 Load Balancer = 1 x 5.83 € = 5.83 €
Total: 46.88 €
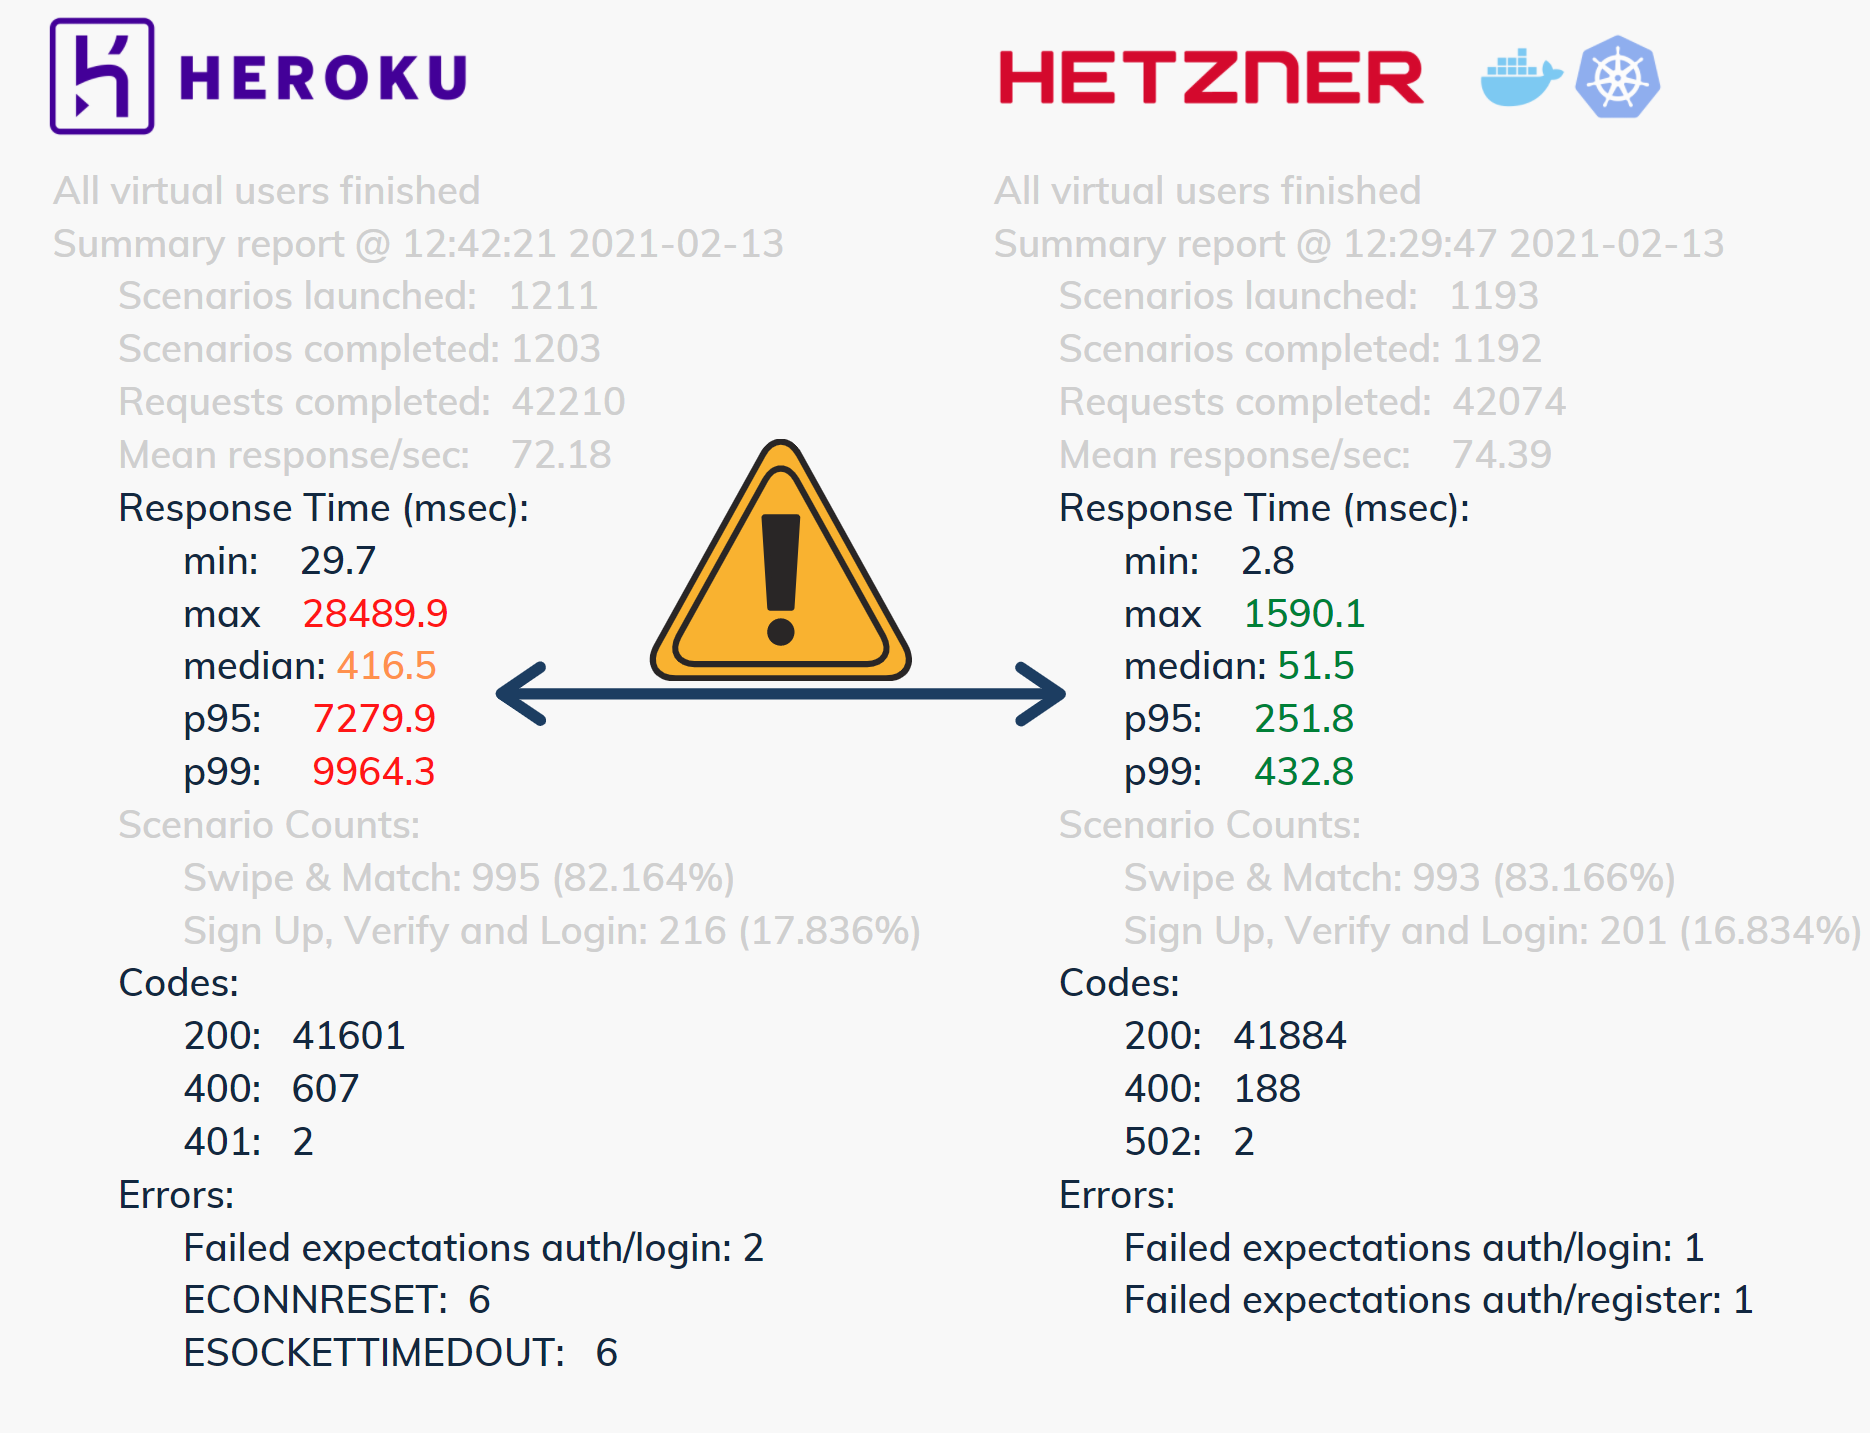
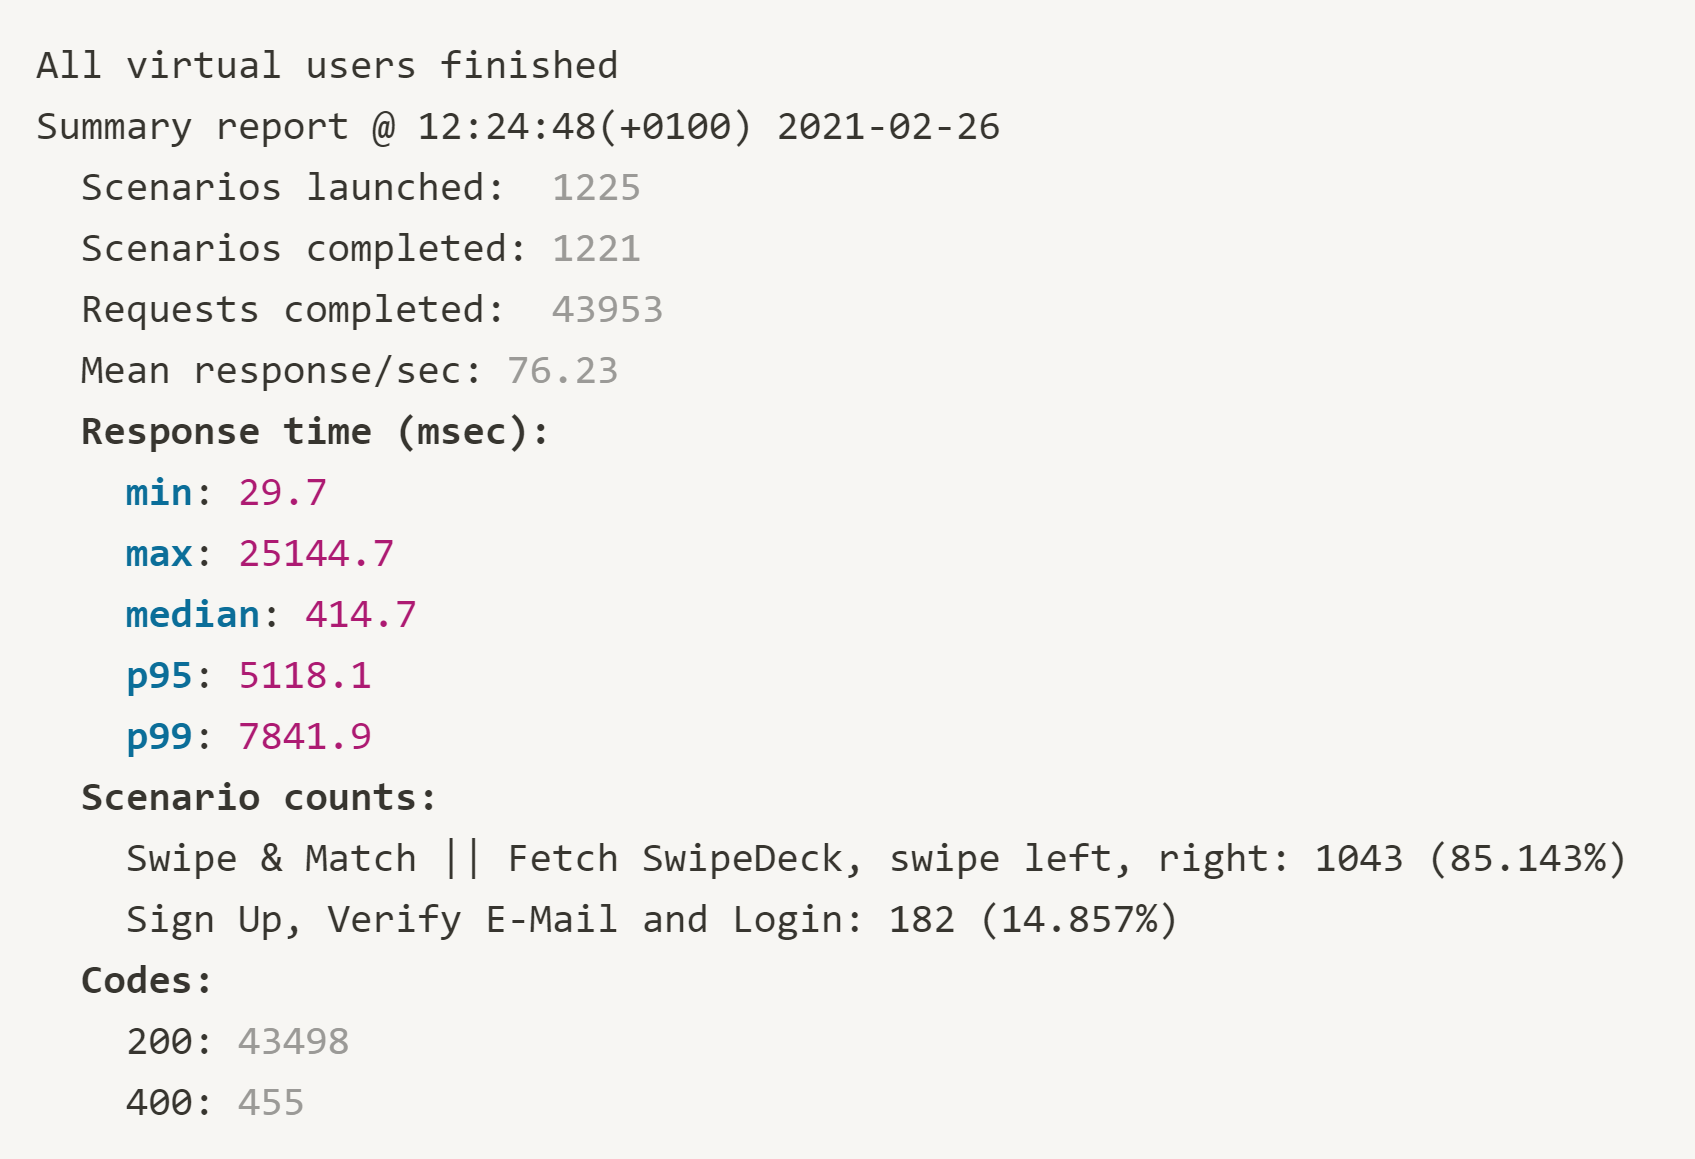
In the results depicted below, a Standard-2X dyno was used in Heroku. This is roughly comparable to the costs of the production cluster on Hetzner (Heroku 41.30 €, Hetzner 46.88 €). Accordingly, this load test only refers to the resources for the actual workload, i.e. the application itself. As can be seen in the results, Heroku’s response times are very poor. Response times of up to ten seconds in the p99-quantile are absolutely unacceptable for the application context we dealt with (and probably for any other as well).
But of course we still need the Rancher HA cluster itself for our new infrastructure on Hetzner, so we did a second test to give Heroku a fairer chance. For this we rented two Dynos of type “Standard-2X”. In summary:
Heroku: 2x Standard-2X = 2 x 41.30 € = 82.60 €
Hetzner: Rancher HA cluster + production cluster = 17.49 € + 46.88 € = 64.37 €
Unfortunately for Heroku, we still see disappointing results regarding its performance. Five seconds in p95- or eight seconds in p99-quantile is simply not acceptable, and in all honesty, slow. That is not really surprising though, since the metrics provided by Heroku clearly showed that resources were saturated and therefore exhausted.
Our curiosity has motivated us to continue the experiment to find out at which point Heroku can achieve similar or at least acceptable results. Therefore we performed several more load tests with varying allocated resources.
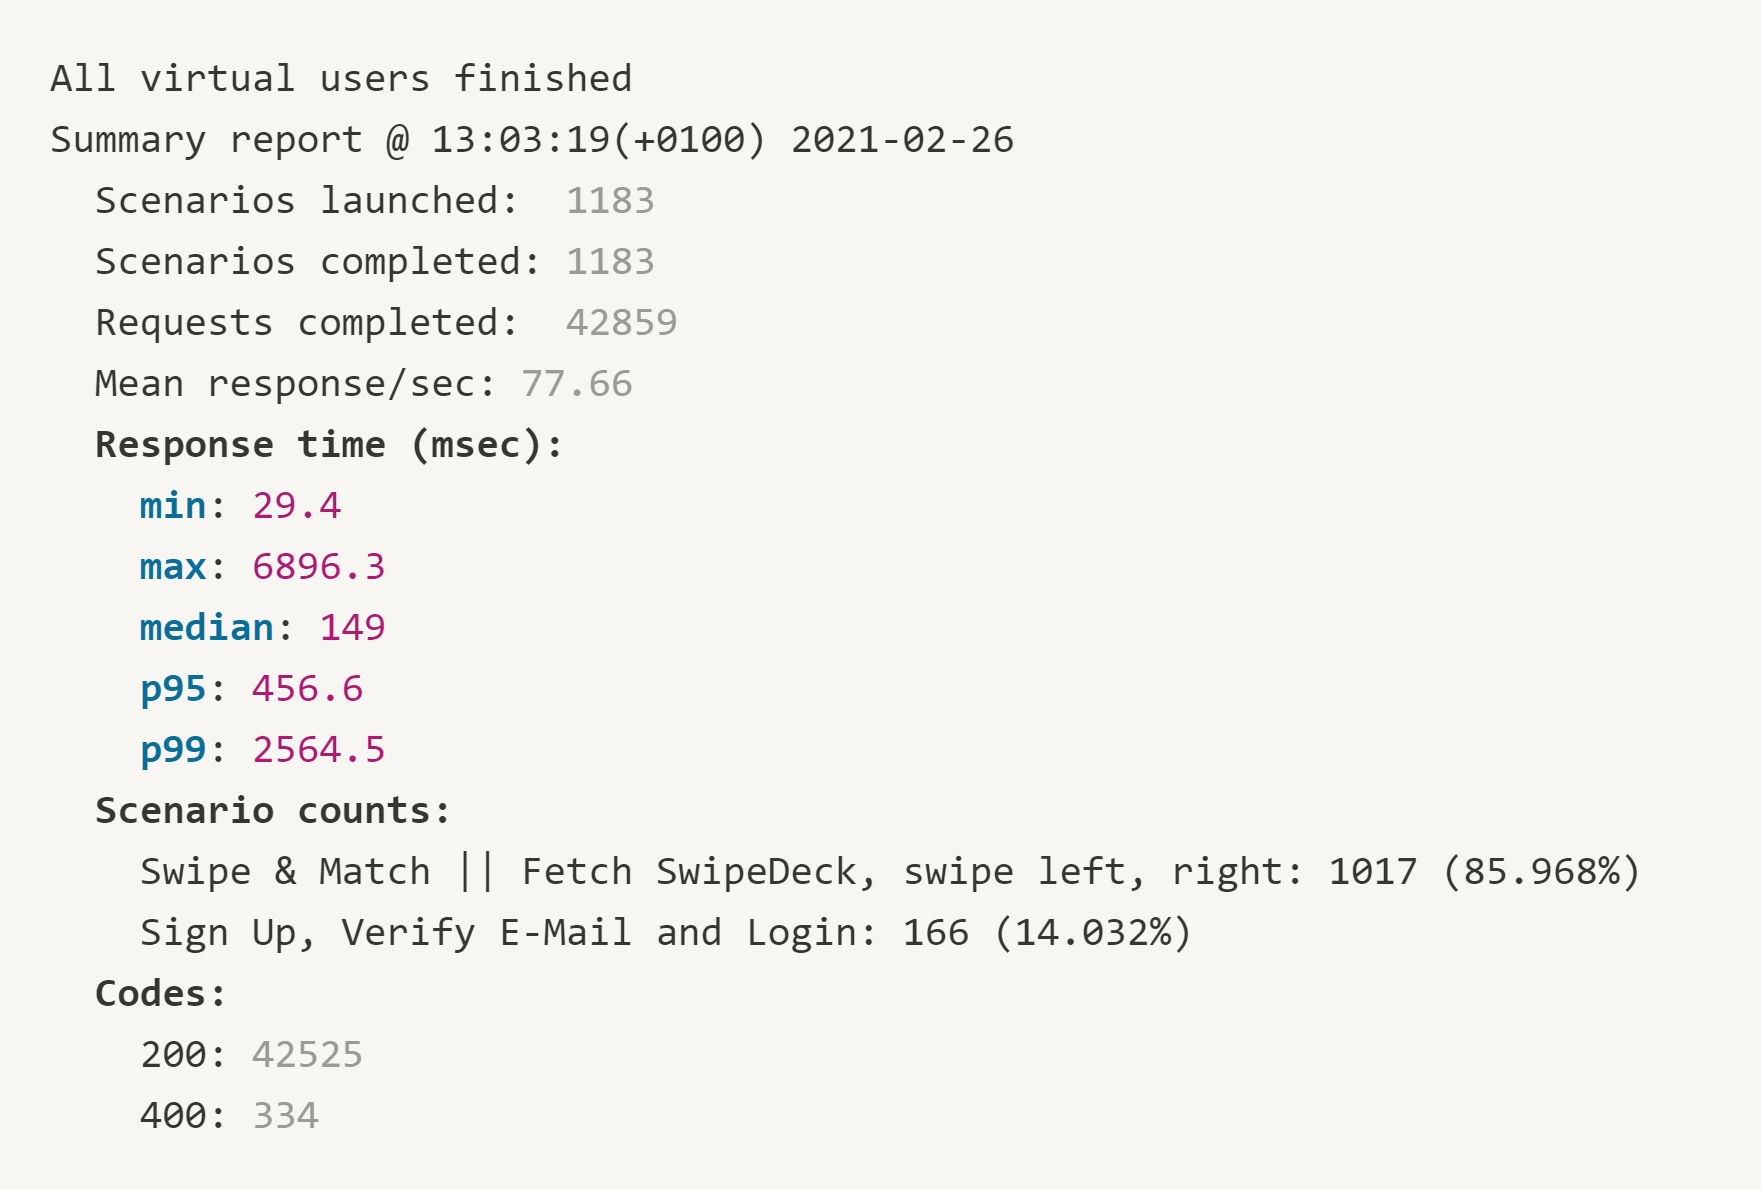
Only when using eight dynos of type “Standard-2X” satisfactory results were achieved. This setup would cost a total of 330 € monthly, so about five to six times more than our new infrastructure on Hetzner. In the p95-quantile, Heroku now achieves an approximately comparable result to our Hetzner setup (Heroku 456 ms, Hetzner 251 ms). The outliers, i.e. the maximum response times, have also decreased considerably in this case. Thus, “only” a maximum response time of 6.8 s was recorded instead of the previously recorded 25 s.
In summary, we were able to achieve a significant performance improvement with the migration to Hetzner and also made the application significantly more scalable and future-proof overall. One remark that has to be made at this point: scaling with Heroku is really fast. Increasing from four to eight Standard-2X dynos, for example, takes only a few seconds and thus doubles the usable resources almost immediately. Adding a new worker instance in our new Kubernetes cluster takes a few minutes, as this requires first instantiating a new instance on Hetzner and then going through the appropriate configuration steps. The horizontal scaling of our workload, however, also takes only a few seconds and is thus ready for use almost immediately.
Reflection and Lessons Learned
This project had the special aspect that it was based on a real app and the goal was to update and improve the entire infrastructure around this application. None of us has had any experience with that. The used technologies such as Rancher or Kubernetes were all new to us. As a result, we were able to acquire a lot of new valuable knowledge and gain some experience with technologies that are currently very popular and can be considered as state-of-the-art.
We were happy with Rancher as an open-source tool that made the setup easier since it comes along with a clean user interface due to which it is not necessary to fiddle around with several YAML configuration files. Especially the Hetzner Node Driver came in handy for us because it adds a really helpful amount of automation to the infrastructure and makes scaling very easy. Instances can be added or removed from the cluster with only a few clicks. However, Rancher did not seem to be as stable as we wished, e.g. the previously mentioned cluster creation problem presents an obstacle that could be avoided.
Overall, it is still nice to have such a tool where cluster creation and management can be done much easier and faster. In retrospect, a better approach could have been to add Rancher at a later step. It adds an abstraction layer over Kubernetes. Since we had no experience in this field whatsoever, we had no idea what Rancher actually does in the background. We believe dealing with plain Kubernetes and its concepts at first would have helped to get a better understanding of the different Kubernetes components and the actions taking place automatically behind the scenes by Rancher.
Another point which we have already mentioned as part of one of our challenges is the topic logging: For some problems in this project, we ended up finding the solution by searching through different log files. Especially with Kubernetes, the different log files are widely scattered in different containers across multiple instances. A central logging system that is integrated into the whole system from the beginning surely would have been helpful and might have streamlined some debugging challenges.
During the implementation, we thought a lot about the effort, resources and costs required for the planned infrastructure and evaluated these aspects against the benefit that comes along with it. Especially in the context of a startup, the costs are an important factor. When it came to the installation and infrastructure, we noticed how time-consuming and resource-intensive a project like this can be. We often discussed whether certain steps were even worth the effort for the size of this project. However in the end, we realized that once the setup is done, all the effort and overhead pays off, especially in regards to the easy and efficient scaling possibilities for the future.
The Future
The result of this project has to be validated over the coming weeks and months before using it in production. To list some things that need to be done:
- validate the automatic renewal of certificates by Cert-Manager
- check the reliability and stability of the cluster in a real load environment
- monitor all functionalities and their performance
- make sure that all configurations are correct
In addition to the validation, some things touched in this project could still be expanded or adapted:
- Central logging: While we noted in the lessons learned that central logging would have been helpful, we did not do this as part of this project. Sooner or later, a form of central logging should be implemented for the cluster and the application.
- Integration of Artillery into CI/CD: The load tests we performed could become part of the CI/CD pipeline. Therefore, these load tests could become an automatic part of the flow.
- Separation of admin dashboard and API in containers: In the beginning, we decided to have only one Docker container for the API and the admin dashboard. This could be further split into two separate containers in the future. This is not currently planned, but could lead to even better scalability.
Further Reading
- https://containerjournal.com/topics/container-ecosystems/5-container-alternatives-to-docker/
- https://www.ctl.io/developers/blog/post/what-is-docker-and-when-to-use-it/
- https://www.inovex.de/blog/containers-docker-containerd-nabla-kata-firecracker/#:~:text=Rocket%20(rkt)&text=As%20of%20march%202020%2C%20rkt,develop%20yourself%20if%20you%20wanted.
- https://sre.google/sre-book/monitoring-distributed-systems/
- https://static.googleusercontent.com/media/sre.google/en//static/pdf/building_secure_and_reliable_systems.pdf
- https://luminousmen.com/post/kubernetes-101
- https://github.com/kelseyhightower/kubernetes-the-hard-way
- https://knapsackpro.com/ci_comparisons/jenkins/vs/github-actions
- https://docs.github.com/en/actions
- https://www.dev-insider.de/container-orchestrierung-mit-rancher-a-886962/
- https://rancher.com/docs/rke/latest/en/installation/
- https://rancher.com/docs/rancher/v2.x/en/installation/install-rancher-on-k8s/
- https://jmrobles.medium.com/how-to-create-a-kubernetes-cluster-with-rancher-on-hetzner-3b2f7f0c037a
- https://vitobotta.com/2020/10/30/kubernetes-hetzner-cloud-rancher-custom-nodes/
- https://vitobotta.com/2020/11/10/kubernetes-hetzner-cloud-rancher-node-driver/
- https://cert-manager.io/docs/tutorials/acme/ingress/
Leave a Reply
You must be logged in to post a comment.